

Thu, Mar 1, 2018

Historically, building a system that can answer natural language questions about any image has been considered a very ambitious goal. Imagine a system that, given the image below, could answer these questions:
- What is in the image?
- Are there any humans?
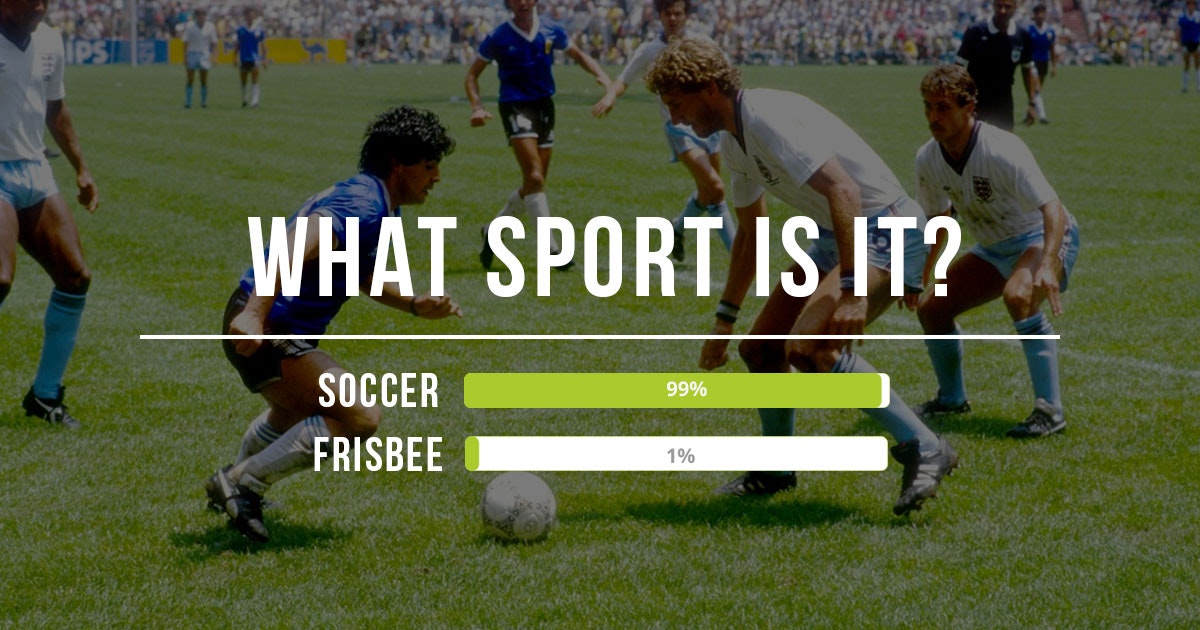
- What sport is being played?
- Who has the ball?
- How many players are in the image?
- Who are the teams?
- Is it raining?

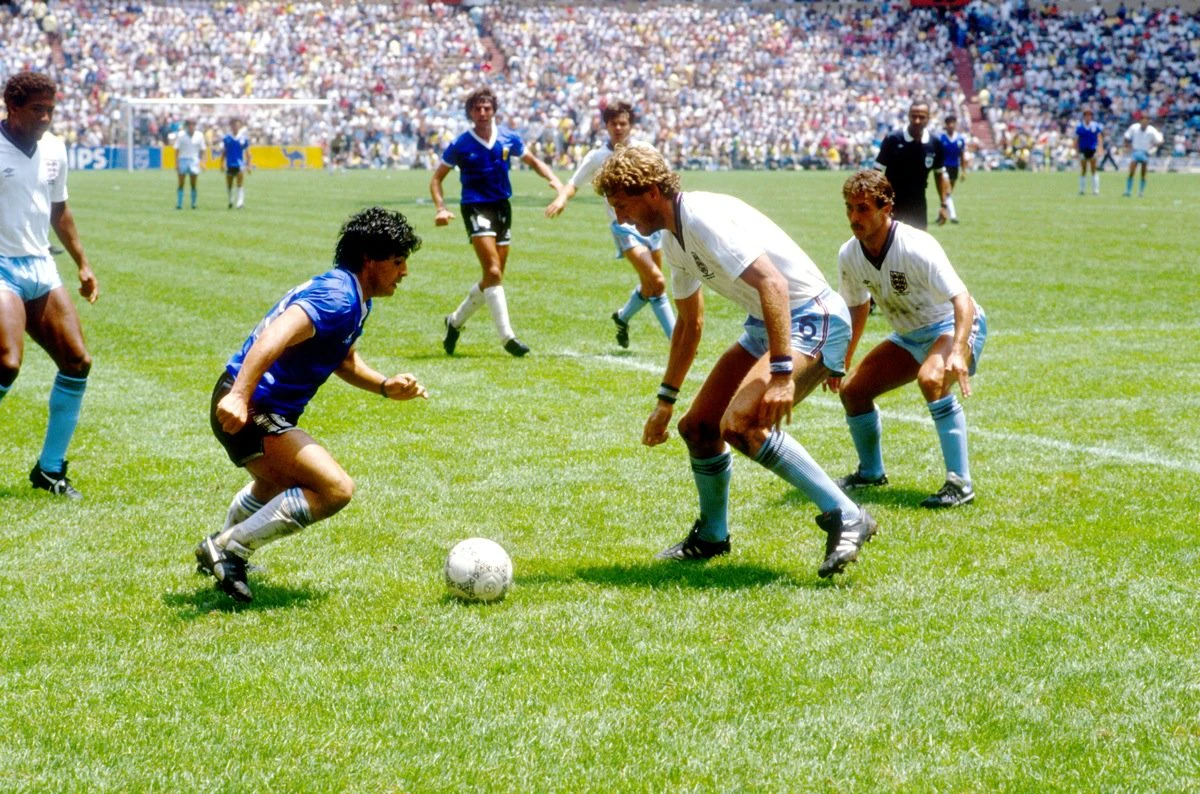
So, how many players are in the image? Well, we can count them and see that there are eleven players, since we are smart enough not to count the referee, right?
Although as humans we can normally perform this task without major inconveniences, the development of a system with these capabilities has always seemed closer to science fiction than to the current possibilities of Artificial Intelligence (AI). However, with the advent of Deep Learning (DL), we have witnessed enormous research progress in Visual Question Answering (VQA), in such a way that systems capable of answering these questions are emerging with promising results.
In this article I will briefly go through some of the current datasets, approaches and evaluation metrics in VQA, and on how this challenging task can be applied to real life use cases.
A multi-discipline problem
In a general way we can define a VQA system as an algorithm that takes as input an image and a natural language question about the image and generates a natural language answer as the output. This is by nature a multi-discipline research problem. Let’s take, for example, the questions about the previous image. We need NLP for at least two reasons: to understand the question and to generate the answer. These are common problems in text-based Q&A, a well studied problem in NLP. Given the following sentence:
How many bridges are there in Paris?
a NLP Q&A system is typically going to:
- Classify or type the question: this is a "how many" question, so the response must be a number.
- Extract the object to count: bridges.
- Extract the context where the count must be performed: in this case, the city of Paris.
After the question has been analyzed, the system builds some kind of query and relies on a knowledge base to get the answer. This is far from trivial (e.g. there are at least 22 cities called Paris in the United States), but a lot of work has been done since the 1970s.
The main difference in VQA is that the search and the reasoning part must be performed over the content of an image. So, to answer if there are any humans, the system must be able to detect objects. To say if it is raining, it needs to classify a scene. To answer who are the teams, the system needs world knowledge. Finally, to say which player has the ball, commonsense reasoning and, very likely, knowledge reasoning are necessary. Many of these tasks (object recognition, object detection, scene classification, etc.) have been addressed in the field of Computer Vision (CV), with impressive results in the last few years.
So, as we can see, a good VQA system must be capable of solving a broad spectrum of typical NLP and CV tasks, as well as reasoning about image content. It is clearly a multi-discipline AI research problem, involving CV, NLP and Knowledge Representation & Reasoning (KR).
Available datasets
As with many problems in NLP or CV, such as Machine Translation, Image Captioning or Named Entities Recognition, the availability of datasets is a key issue. They allow, in combination with well defined metrics (see the "Evaluation metrics" section below), to fairly compare different approaches, to compare them with human decisions and to measure how they perform in an absolute way, that is, to determine the empirical limitations of the state-of-the-art.
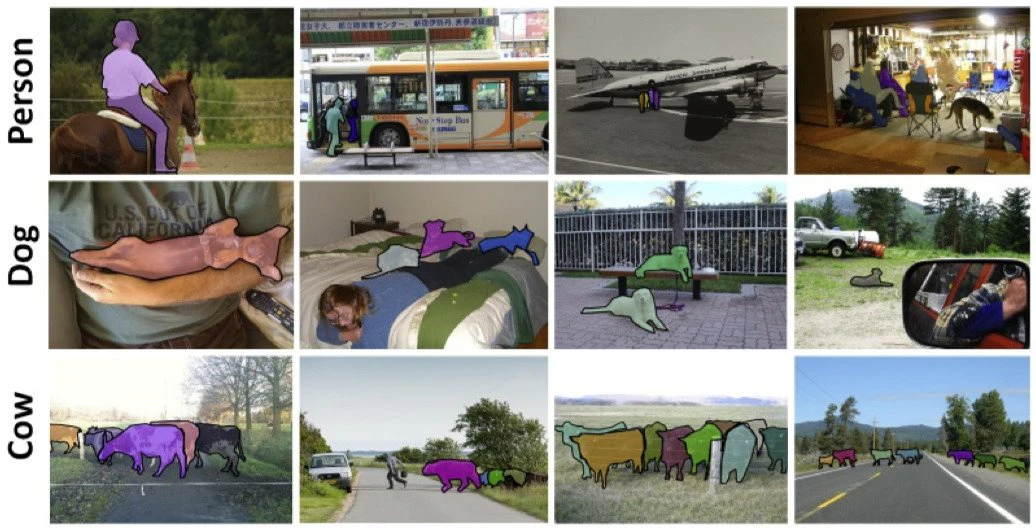
The VQA field is so complex that a good dataset should be large enough to capture the long range of possibilities within questions and image content in real world scenarios. Many of the datasets contain images from the Microsoft Common Objects in Context (COCO), a dataset with 328,000 images having 91 objects types that would be easily recognizable by a 4 year old, with a total of 2.5 million labeled instances.

The COCO dataset can simplify and accelerate the process of building a VQA dataset. However, it is not an easy task. For example, collecting varied, convenient and non ambiguous questions is a great challenge. Besides the variety and precision problem, a good dataset also has to avoid biases that could be exploited. For example, given a dataset with only yes/no answers, where 90% of the answers are yes, a trivial most frequent class strategy will obtain an accuracy of 90%, without solving anything in terms of VQA.
To get deeper into the VQA complexity, let’s see some of the most important datasets released.
The DAQUAR dataset
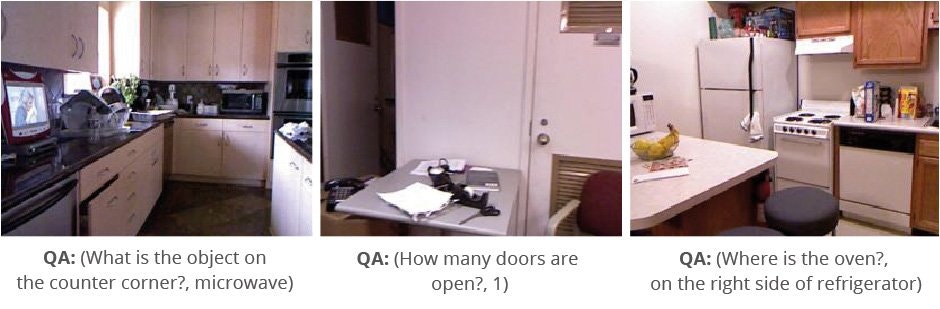
The first significant VQA dataset was the DAtaset for QUestion Answering on Real-world images (DAQUAR). It contains 6794 training and 5674 test question-answer pairs, based on images from the NYU-Depth V2 Dataset. That means about 9 pairs per image on average.
Although it is a great initiative, the NYU dataset contains only indoor scenes with, sometimes, lightning conditions that make it difficult to answer the questions. In fact, evaluation on humans shows an accuracy of 50.2%.

The other drawback of the DAQUAR dataset is that its size makes it unsuitable for training and evaluating complex models.
The COCO-QA dataset
The COCO-QA dataset is significantly larger than DAQUAR. It contains 123,287 images coming from the COCO dataset, 78,736 training and 38,948 testing QA pairs. To create such a large amount of QA pairs, the authors used a NLP algorithm to automatically generate them from the COCO image captions. For example, for a given caption such as "Two chairs in a room", they would generate a question like “How many chairs are there?". It must be noted that all the answers are a single word.
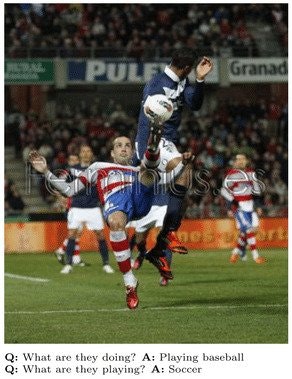
Although this is very clever, the obvious issue here is that the questions suffer from the inherent NLP limitations, so they are sometimes bizarrely formulated or have grammatical errors. In some cases, they are simply incomprehensible:

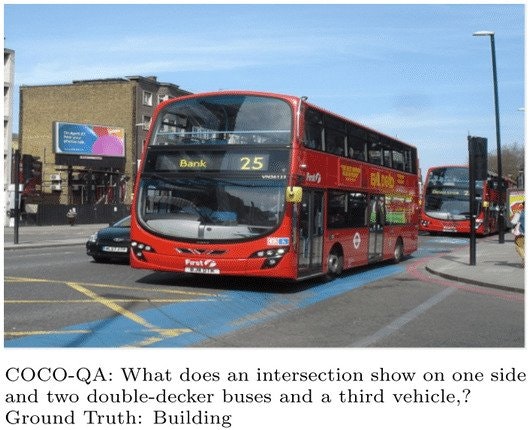
Another inconvenience is that the dataset only has four kinds of questions, not equally distributed: object (69.84%), color (16.59%), counting (7.47%) and location (6.10%).
The VQA dataset
Compared to other datasets, the VQA dataset is relatively larger. In addition to 204,721 images from the COCO dataset, it includes 50,000 abstract cartoon images. There are three questions per image and ten answers per question, that is over 760K questions with around 10M answers. To achieve this, a team of Amazon Mechanical Turk workers generated the questions and another team wrote the answers.
One interesting point is that for testing, they propose two kind of answer modes: open-ended and multiple-choice. For the first mode, they propose the following metric:
// math
That means that an answer is considered 100% accurate if at least 3 workers provided that exact answer.
For the multiple-choice mode, they create 18 candidate answers (correct and incorrect) per question:
The Correct Answer: The most common answer given by the ten annotators.
Plausible Answers: Three answers collected from annotators without looking at the image.
Popular Answers: The top ten most popular answers in the dataset (e.g. "yes", “no”, “2”, “1”, “white”, “3”, “red”, “blue”, “4”, “green” for real images)
Random Answers: Randomly selected correct answers for other questions.
Despite the precautions taken in the design of the dataset (e.g. the inclusion of popular answers makes it more difficult to infer the type of question from the set of answers), we can observe some issues. Maybe the most striking one is that some questions are too subjective to have a single right answer. Sometimes, like in the case of the image below, a most likely answer can be given.

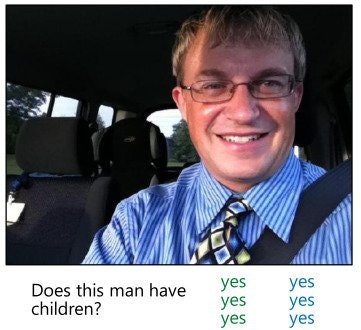
We can not say that this man has children, but it is without doubt the most likely answer. However, there are questions such as "Would you like to fly in that?" over the image of an airplane, that do not have a correct answer.
Finally, a major drawback regards what we could call trivial questions, that is questions that generally don’t need an image to have a good (or likely) answer. For example: "how many legs does the dog have?" or “what color are the trees?”, where, although not always correct, four and green are the most frequent and obvious answers.
Current approaches
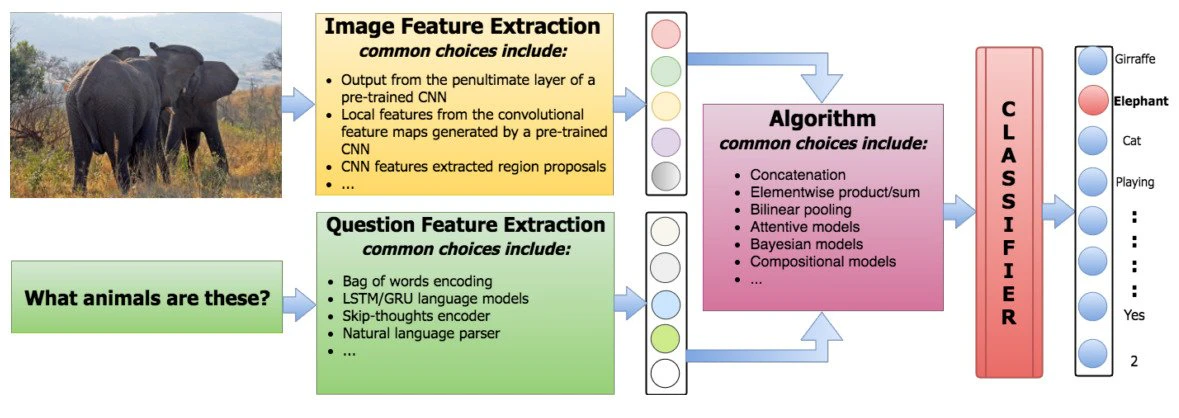
In general, we can outline the approaches in VQA as follows:
Extract features from the question.
Extract features from the image.
Combine the features to generate an answer.
For text features, techniques such as Bag-Of-Words (BOW) or Long Short Term Memory (LSTM) encoders can be used. In the case of image features, CNNs pre-trained on ImageNet is the most frequent choice. Regarding the generation of the answer, the approaches usually model the problem as a classification task.

Thus, the main difference between several approaches is how they combine the textual and image features. For example, they can simply combine them using concatenation and then feed a linear classifier. Or they can use Bayesian models to infer the underlying relationships between the feature distributions of the question, the image and the answer. Since the large number of algorithms proposed in the last years exceeds the purpose of this post, I will only mention some of them. For a more detailed comparative analysis, I recommend you to read this excellent survey on VQA, by Kafle and Kanan.
Baselines
As for many classification problems, a trivial baseline consists on always giving the most frequent answer to any question. Another trivial baseline is to pick up a random answer. For instance, the work by Antol et al. (2016) shows that always selecting the most popular answer from the top 1K answers on the VQA dataset (the answer is "yes") leads to an accuracy of 29.72%. Leaving aside that this probably has to do with an undesired dataset bias, such a result illustrates the importance of having good baselines: they determine the minimal level of performance acceptable, and can also give a hint about the inherent complexity of the task and/or the dataset.
A more sophisticated baseline, widely used in VQA, consists on training a linear classifier or a multilayer perceptron using vectors representing a combination of the features as input. This combination can be a simple concatenation or a element wise sum or product of the features.
For example, the previous cited work experiments with two models:
- a multi-layer perceptron (MLP) neural network classifier with two hidden layers and 1000 hidden units (dropout 0.5) in each layer with tanh non-linearity.
- an LSTM model followed by a softmax layer to generate the answer.
In the first case, for the textual features they use a BOW approach, using the top 1,000 words in the questions and the 1,000 most popular words in the captions to compute them. For the image features they use the last hidden layer of VGGNet. As for the LSTM model, they use a one-hot encoding for the questions, and the same image features as above followed by a linear transformation to transform the image features to 1024 dimensions to match the LSTM encoding of the question. Question and image encodings are combined via element wise multiplication.
The performances achieved by these baselines are very interesting. For example, if the models are trained only on textual features, the accuracy is 48.09%, whereas if they are trained only on visual features it goes down to 28.13%. Their best model, a LSTM trained on both kind of features, has an accuracy of 53.74%. The authors confirm that results on multiple-choice are better than open-answer and, as expected, all methods are significantly worse than human performance.
Many variations in this framework can be implemented to obtain different baselines.
Approaches based on attention
The goal of the attention-based approaches is to set the focus of the algorithm on the most relevant parts of the input. For example, if the question is "What color is the ball?", the image region containing the ball is more relevant than the others. In the same way, “color” and “ball” are more informative that the rest of the words.
The most common choice in VQA is to use spatial attention to generate region specific features to train CNNs. There are two common methods to obtain the spatial regions of an image. First, by projecting a grid over the image.

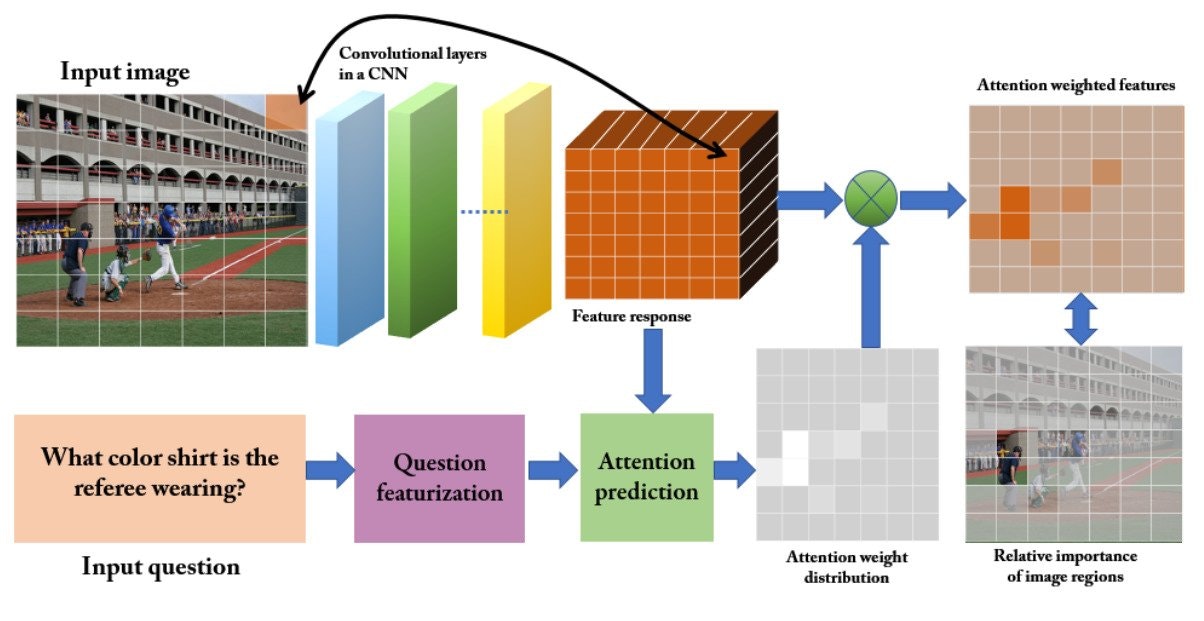
After the grid has been applied, the relevance of each region is determined by the specific question.
The other way is by proposing automatically generated bounding boxes.

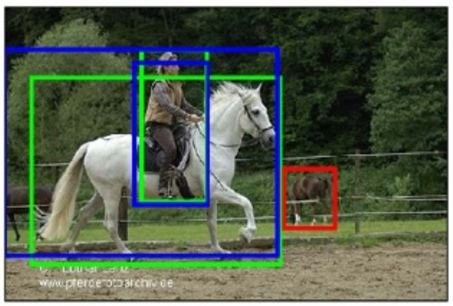
Given the proposed regions, we can use the question to determine the relevance of the features for each one, and to pick only those that are necessary to answer the question.
These are only two techniques to incorporate attention to VQA systems, and many more can be found in the literature.
Bayesian approaches
The idea behind bayesian approaches is to model co-occurrence statistics of both the question and the image features, as a way of inferring relationships between questions and images.
In Kafle and Kanan (2016), for example, the authors model the probability of image features given the question features and the type of the answer. They do so because they observe that given a question, the type of answer can be frequently predicted. For example, "How many players are in the image?" is a “how many” question, that needs a number as an answer. To model the probabilities they combine a Bayesian model with a discriminative model. Regarding the features, they use ResNet for the images and skip-thought vectors for text.
Evaluation metrics
It may seem obvious, but it is good to remember: the performance of any system (and consequently the state-of-the-art in a given domain) depends on the metrics with which it is evaluated. In VQA, the most straightforward metric we can use is classic accuracy. While this is a reasonable option for multiple-choice answer systems, when it comes to open-ended answers it tends to be very penalizing. If the ground truth answer is "oak tree", does that mean that the answer “tree” is absolutely incorrect? If the question is “What animals appear in the image?”, and the image shows dogs, cats and rabbits, how incorrect the answer “cats and dogs” should be?
These are very complex issues that have to be addressed in order to evaluate the different approaches as precisely as possible.
WUPS
The WUPS measure, proposed by Malinowski and Fritz in 2014, and based on the WUP measure by Wu and Palmer back in 1994, estimates the semantic distance between an answer and the ground truth, that is a value between 0 and 1. They rely on WordNet to compute similarity using the distance, in the semantic tree, of the terms contained both in the answer and the ground truth. That way, for single terms, we could get results such as:
// math // math
As with almost all semantic measures, WUPS assigns relatively significant values to terms that are absolutely disconnected. To address this issue, the authors proposes to scale down by a factor of 0.1 the scores below 0.9.
It is undeniable that for many cases WUPS fits better than classic accuracy. However, since it relies on semantic similarity, the answer ‘red’ will have a very high score if the ground truth is ‘black’ or ‘green’ or another color. The other problem is that it only works in small terms, and only if they have a WordNet meaning.
Multiple independent ground truth answers
Instead of relying on semantic measures, we could have multiple ground truth answers per question, as we saw for the VQA dataset. Then we can, for example, state that a given answer is correct if it matches the more frequent answer, or if at least it matches one of the possible ground truth answers. The latter has to be applied carefully, because of the yes/no questions that do not have a consensual answer: in that case, any answer would be correct.
Manual evaluation
Finally, another way of addressing the evaluation phase is to use human judges to assess the answers. This is, of course, an extremely expensive approach. Moreover, guidelines with clear criteria had to be established so that judges can correctly evaluate the answers. Some type of training should be foreseen, aiming at the good quality of the evaluations and a good agreement between judges.
Real life applications
There are many potential applications for VQA. Probably the most direct application is to help blind and visually-impaired users. A VQA system could provide information about an image on the Web or any social media. Another obvious application is to integrate VQA into image retrieval systems. This could have a huge impact on social media or e-commerce. VQA can also be used with educational or recreational purposes.
The VQA Consortium has a very complete and useful website with information, resources and software on VQA. They hold the VQA Challenge as well as the VQA Challenge Workshop, and it is worthwhile to take a look at the tasks, talks and papers because they give a good hint about the future directions of the field. You can also try CloudCV, a very interesting online demo of a VQA system.
Final thoughts
VQA is a recent field that requires the understanding of both text and vision. Since deep learning techniques are significantly improving NLP and CV results, we can reasonably expect that VQA is going to be more and more accurate in the next years.
As with many other tasks in IA, the built datasets and the defined metrics have somehow shaped the research work that has been done so far. The best way to evaluate a VQA system is still an open question, and it is very likely that new datasets and metrics will allow to deepen and refine the notion of quality.

There are still several remaining issues and ongoing discussions. For example, is it good, appropriate or fair to use multiple-choice datasets, given that a VQA system can be right by chance? Is a system with excellent performance in multiple-choice datasets a good system in real life, where these are not available? What is the impact of the way a question is formulated in the response that is obtained? (see image above)
Although current performances are far from human decisions, the results are already exploitable and, in fact, very promising. As VQA is adopted by large public platforms, devices and tools, it is very likely that it will change the way we search and interact with data.
Wondering how AI can help you?

© 2024. All rights reserved.