

Real Estate pricing with Machine Learning & non-traditional data sources


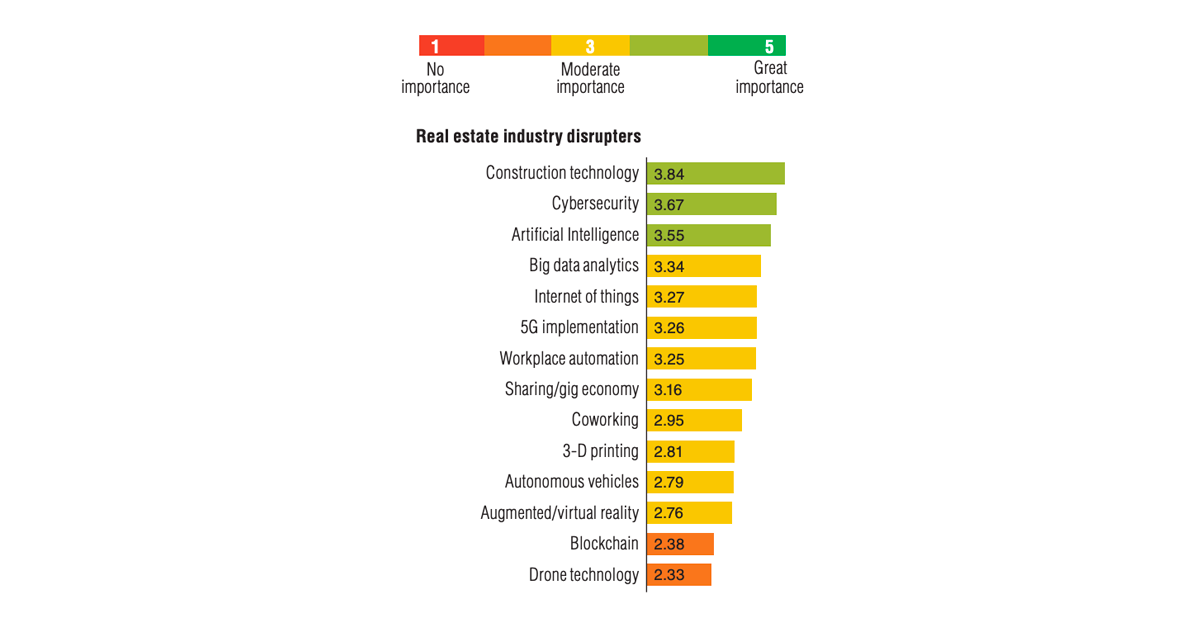
Real estate is the world’s largest asset class, worthing $277 trillion (that's 277 followed by 12 zeros, in case you were wondering), three times the total value of all publicly traded companies. And Machine Learning applications have been accompanying its sector's growth. The main technology trend disrupting real estate today is ML. The publication "Emerging Trends in Real Estate 2021" by PwC reached a similar conclusion: Artificial Intelligence is among the main industry disruptors.

With that said, one of the most popular AI applications in the industry is intelligent investing. This application helps answer questions like:
- Which house should I buy or build to maximize my return?
- Where or when should I do so?
- What is its optimum rent or sale price?
Traditionally, experts answer these questions by reviewing at different data sources . The problem arises when there are thousands or even hundreds of thousands of data points to analyze. This is an increasingly common scenario in which data becomes available faster than companies can process it. Consequently, incorporating data pipelines and algorithms into the decision-making process is crucial to remain competitive in today's big data era.
In this blog post, we will review how Machine Learning leverages the power of data to tackle these pricing-related questions for the real estate industry. We will also explore the limitations of this approach and how combining multiple data sources can help overcome them.
You will find out how Machine Learning is incorporating non-traditional data to predict the best pricing strategy. Can an algorithm consider the property's appearance, surrounding physical and social environment settings, and more? Spoiler alert: it can.
If you are just getting started with Machine Learning in Real Estate, you can check our previous post about the general status and opportunities of the sector.
What were the traditional appraisal methods?
One thing all traditional appraisal methods have in common is that they rely on some form of comparison. Let's review some of them.
🏘 Comps comparison
The most basic method consists of selecting similar properties (in terms of attributes and location) and inferring the target value from the comparables. The comparable homes are often referred to as "comps".
The problem with this method is that no two comps are the same, so adjustments are required. Plus, this method assumes that comps are always available, and this might not be the case.
💰 Cost approach
Another traditional appraisal method is known as the "cost method". The property's market value is established by determining its replacement cost.
The cost is determined by totaling values such as the value of raw land (again, using comparison), the cost of rebuilding a new building that could perform the function of the existing property, and then making necessary adjustments (e.g., deprecation of the existing building).
💸 Profits method
The income approach (also called the "profits method") estimates the value of the property based on the income it generates. The value is linked to the business carried out within that property. For example, the market value of a hotel depends on the potential cash flow derived from ownership.
Many other, more sophisticated methods may be used in determining the appraisal value of a property. For example, the “repeat sales method” where analysis is restricted to just comparing price changes on properties sold more than once. All these traditional appraisal approaches involve expert knowledge and information, which can be very hard to obtain.
Advanced methods
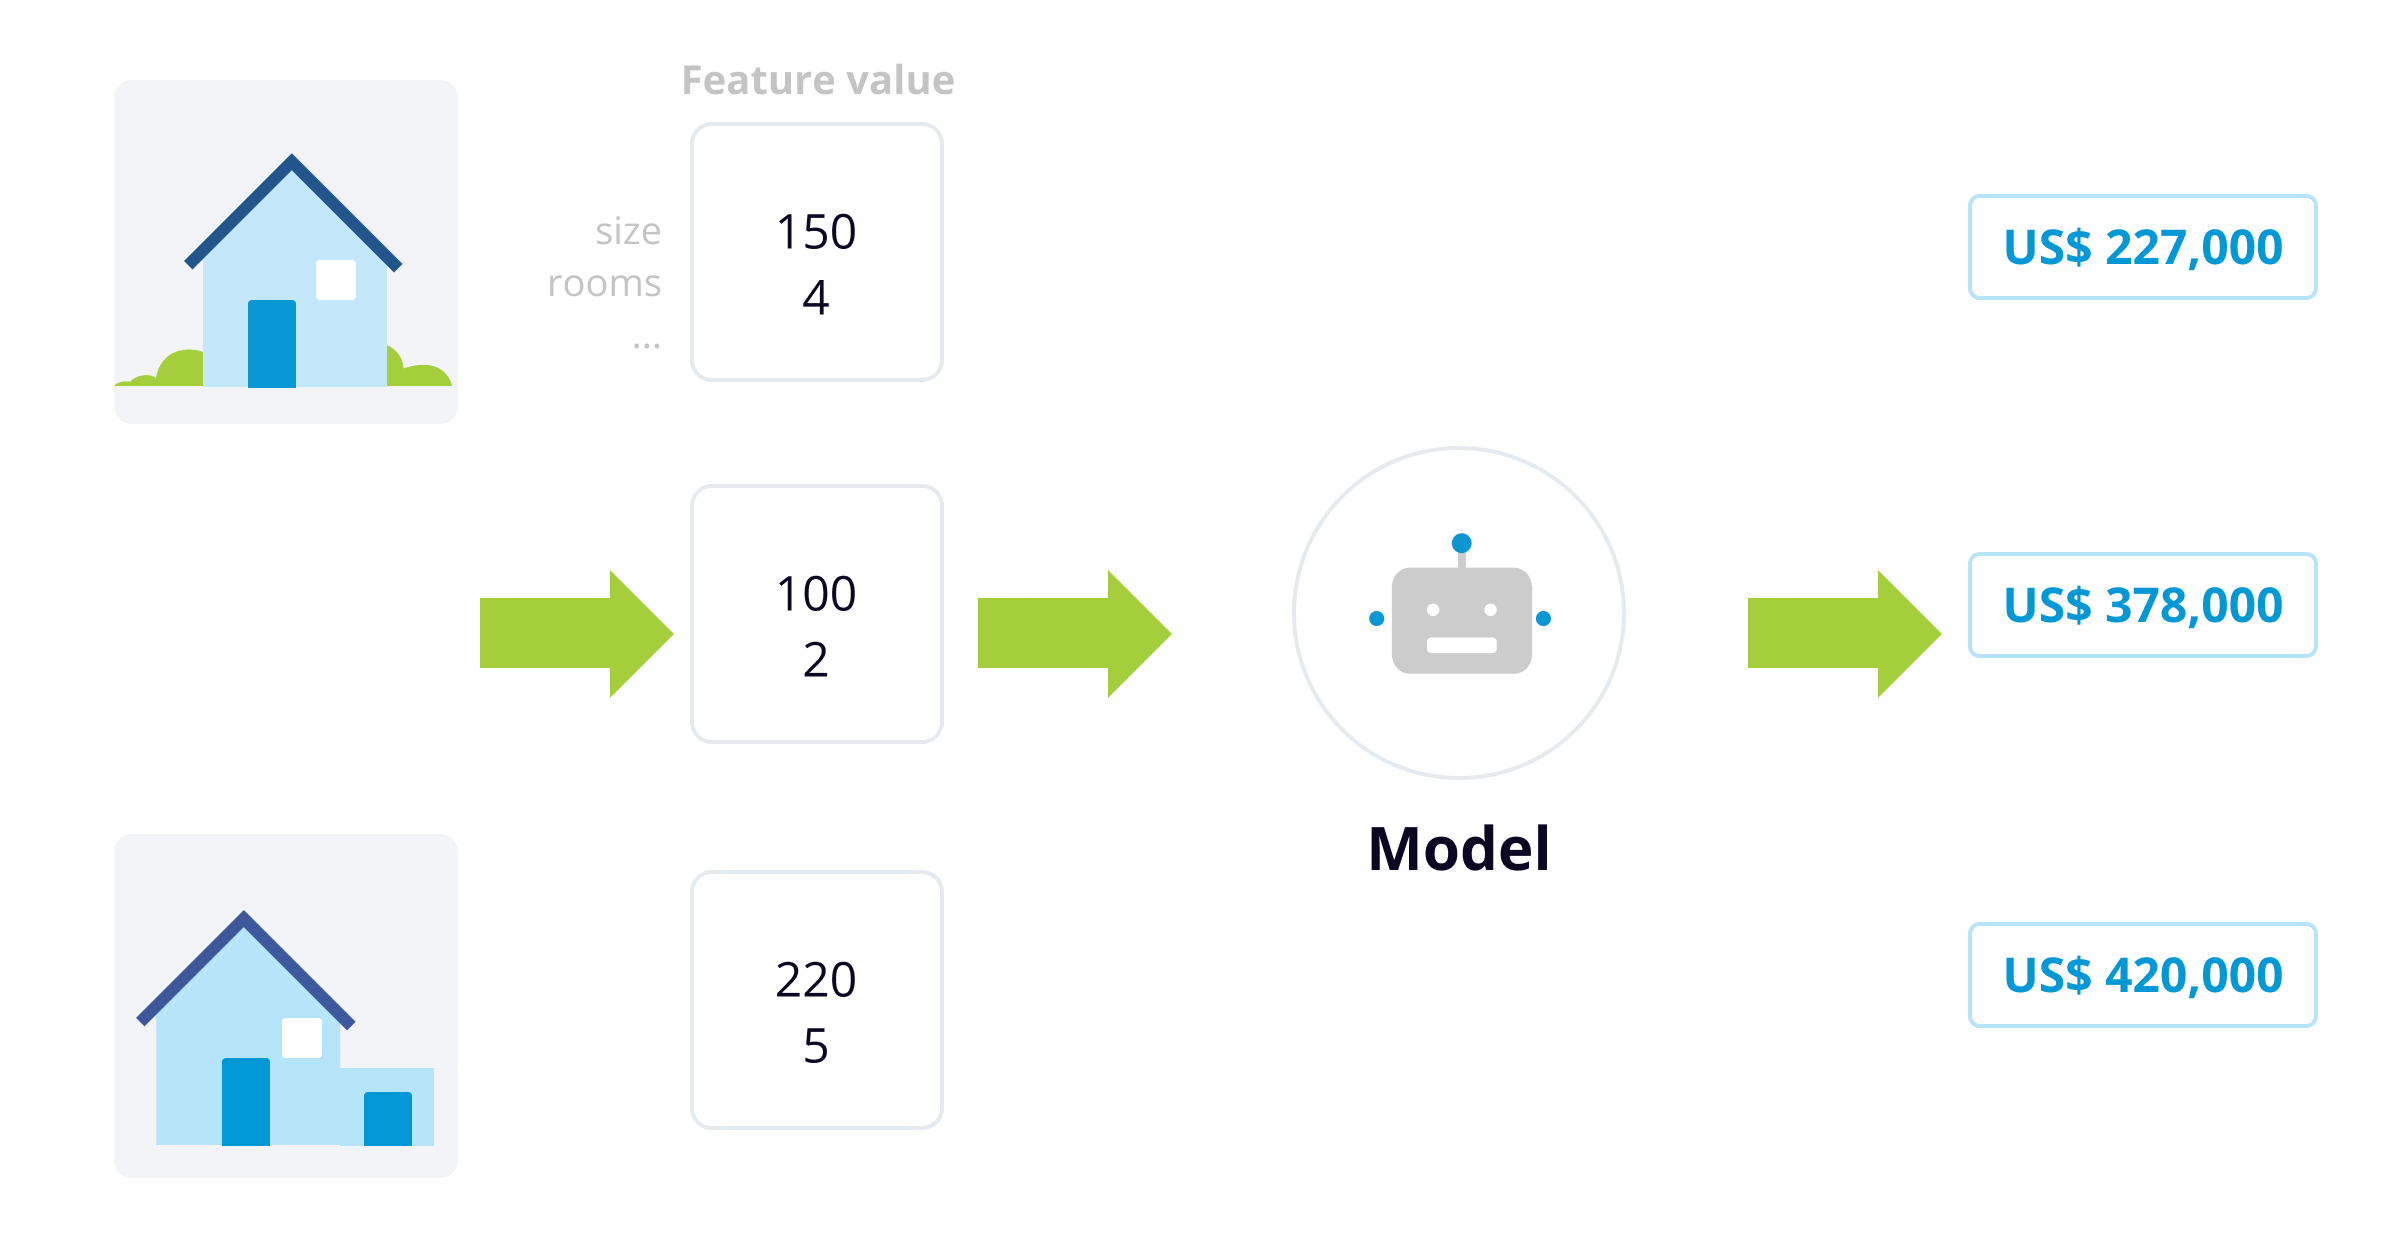
More advanced valuation methods analyze the market by mimicking the players' thought processes in making the decisions. Machine Learning techniques have provided a more sophisticated valuation method based on traditional data.
This is the way it works: a regression algorithm accounts for property features such as size, number of rooms, property age, home quality characteristics (granite countertops, air conditioning, pool, etc.), and location. Assuming that a commodity such as a house can be viewed as an aggregation of individual components or structural attributes is known as the hedonic pricing method. The price estimate is obtained by combining the contributory value of each characteristic.
Different prices can be predicted using Machine Learning, such as:
- Sale price: Zillow and Redfin use their own algorithms for real estate price estimation.
- Rental price: HomeUnion developed a tool called RENTestimate for this.
- Temporary rental price: Airbnb's pricing tips use a mathematical model that learns how likely a guest is to book a specific listing, on specific dates, at a range of different prices.
Automating the pricing process means less time, fewer human errors, and the capability to consider more data.
Automated Valuation Models (also known as AVMs) were found to have an absolute error below 4% for homes and below 6% for commercial properties, which is much less than the error rates of traditional appraisals.

But here’s the kicker: Machine Learning models have been criticized for disregarding key features. For example, the construction quality might not be relevant to an algorithm, but it surely is for a human. Hedonic models that consider structural attributes disregard important information such as the physical appearance of the house, surrounding physical and social environment settings, and dynamic human mobility patterns.
Machine Learning algorithms are beginning to consider nontraditional data to overcome these limitations. Let's explore those different nontraditional data sources that can be used when building a price prediction model.
Revolutionizing appraisal methods with nontraditional data
What is nontraditional data anyways? It's data that comes from new, unconventional sources. More often than not, these features correspond with socioeconomic phenomena that fall beyond a single person's control. An example could be the rating of nearby schools or businesses in the area.
Resident surveys, mobile phone signal patterns, and Yelp reviews of local restaurants help identify "hyperlocal" patterns—granular trends at the city block level rather than at the city level. Macroeconomic and demographic indicators, such as an area’s crime rate or median age, also inform long-term market forecasts. McKinsey.
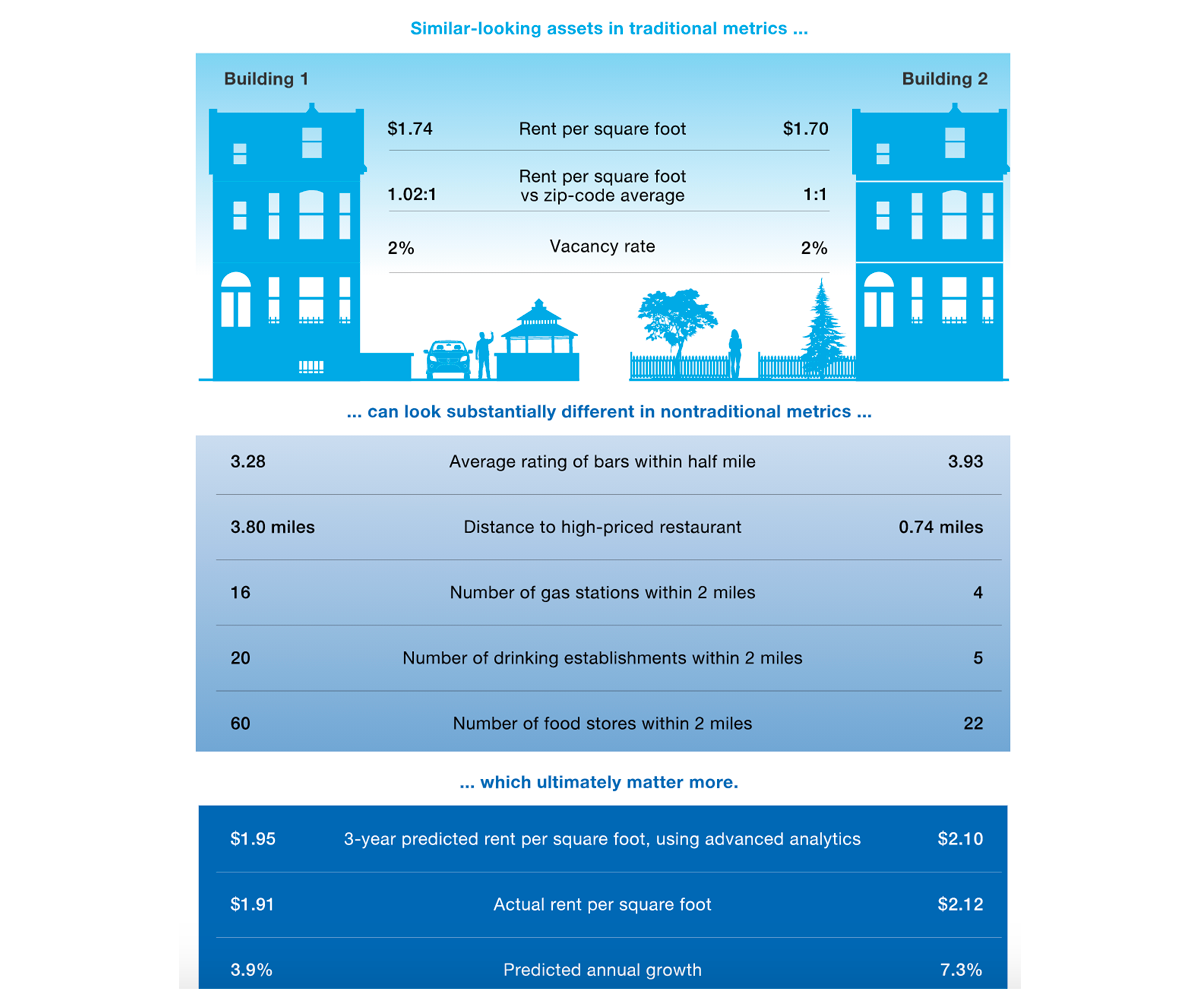
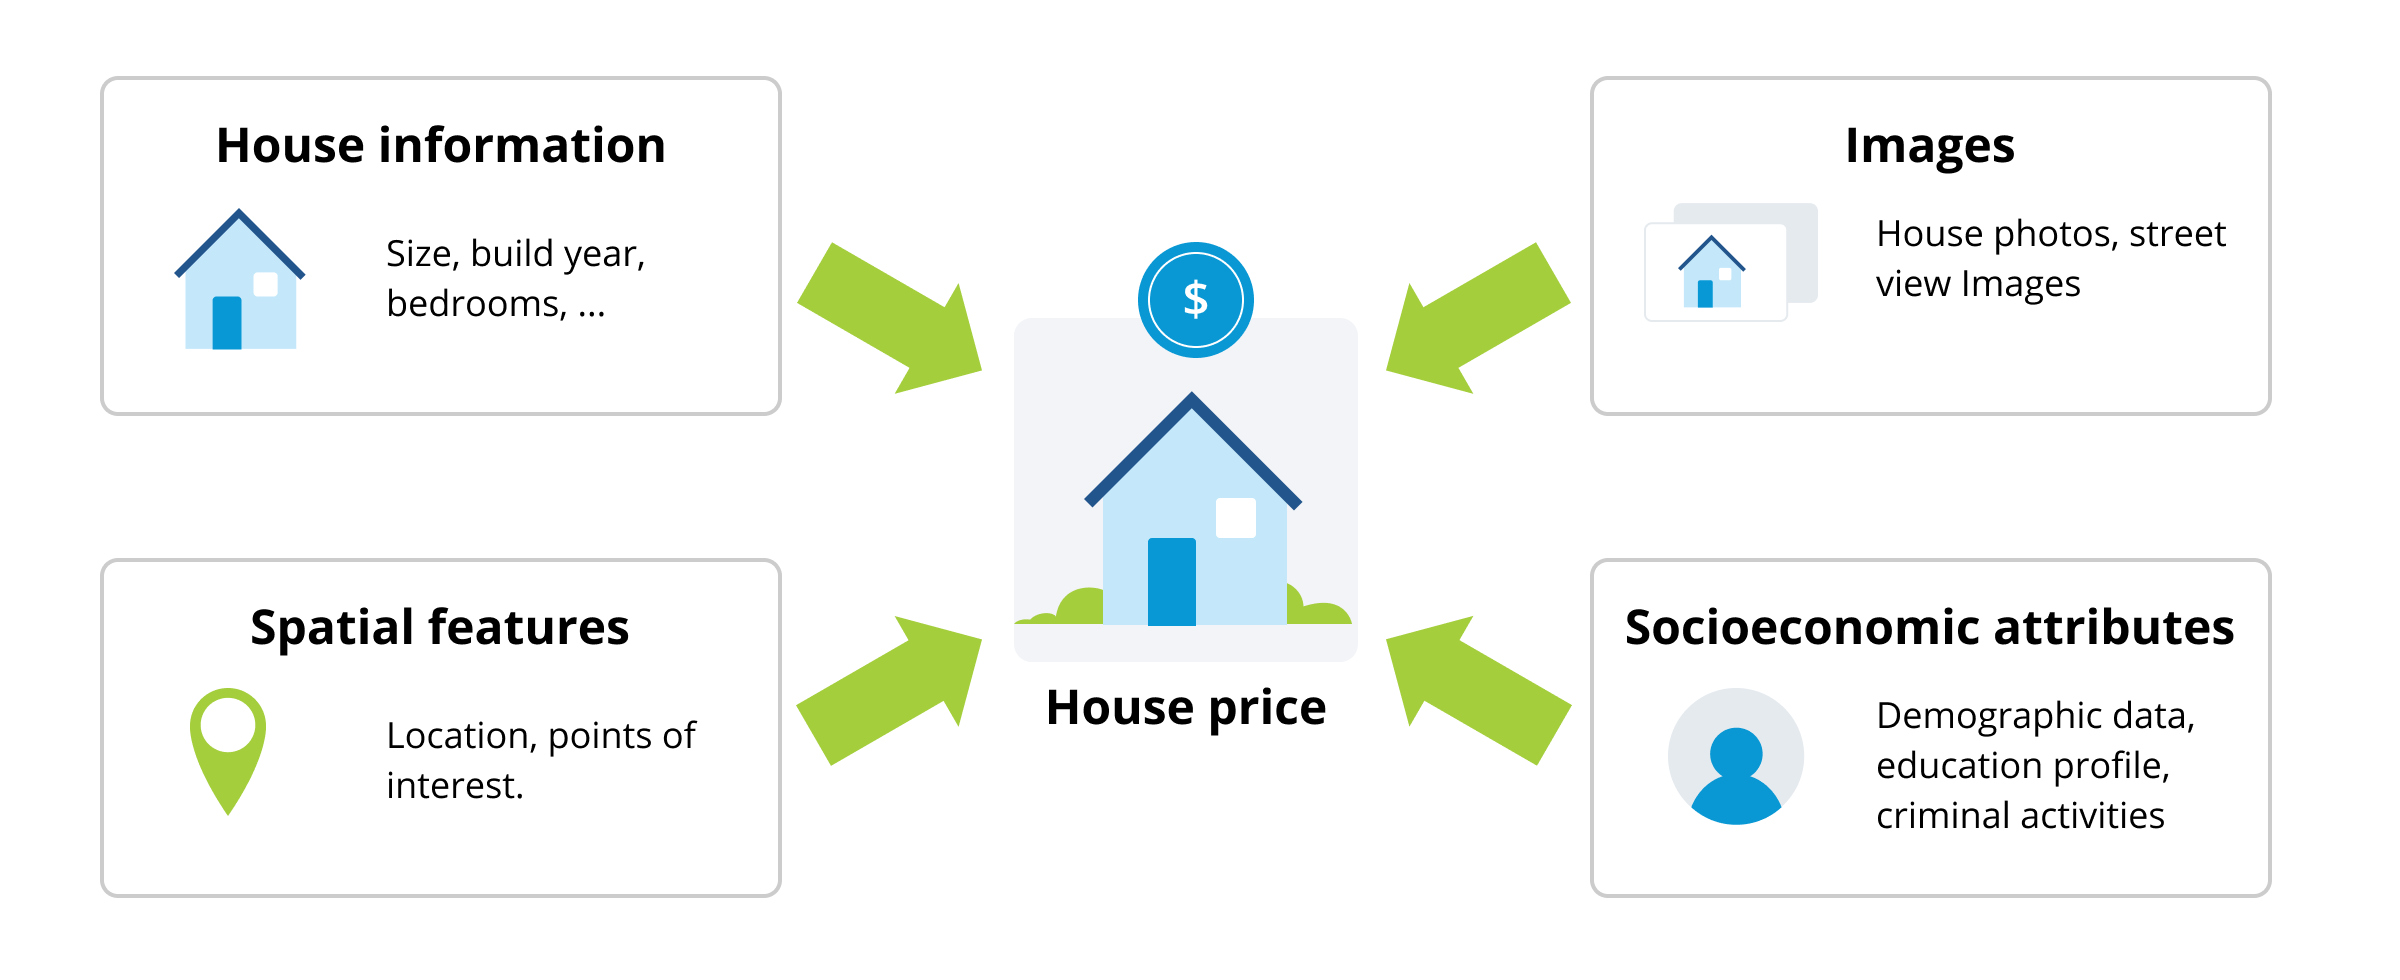
When nontraditional data is used, the results imply that two residential projects identical by traditional metrics can ultimately have a very different price. Taking nontraditional data into account can reflect those differences and improve predictions, as the diagram below shows:

This is nothing new. Buyers intuitively consider many of these factors when deciding which home to purchase (or rent). Real estate appraisers also place a lot of emphasis on these features. However, as we all know, nothing beats AI when it comes to exploiting underlying data patterns.
The magic happens when traditional and nontraditional data are combined. This combination yields a more accurate estimation, which ultimately leads to better forecasts and smarter investment decisions. In one example, traditional and alternative data was used to forecast the three-year rent per square foot for multifamily buildings in Seattle. The machine learning model predicted rents with an accuracy rate that exceeded 90 percent.
Nearly 60% of predictive power can come from nontraditional variables. McKinsey.
Let's go over some examples of what kind of nontraditional data can be used in real estate machine learning.
Exploiting geographic location
Three things matter in real estate: location, location, location. The industry is very familiar with this well-coined phrase. Location can be considered in several different ways when predicting the price of a property. The more traditional approaches consider the zip code or neighborhood in which the property is located.
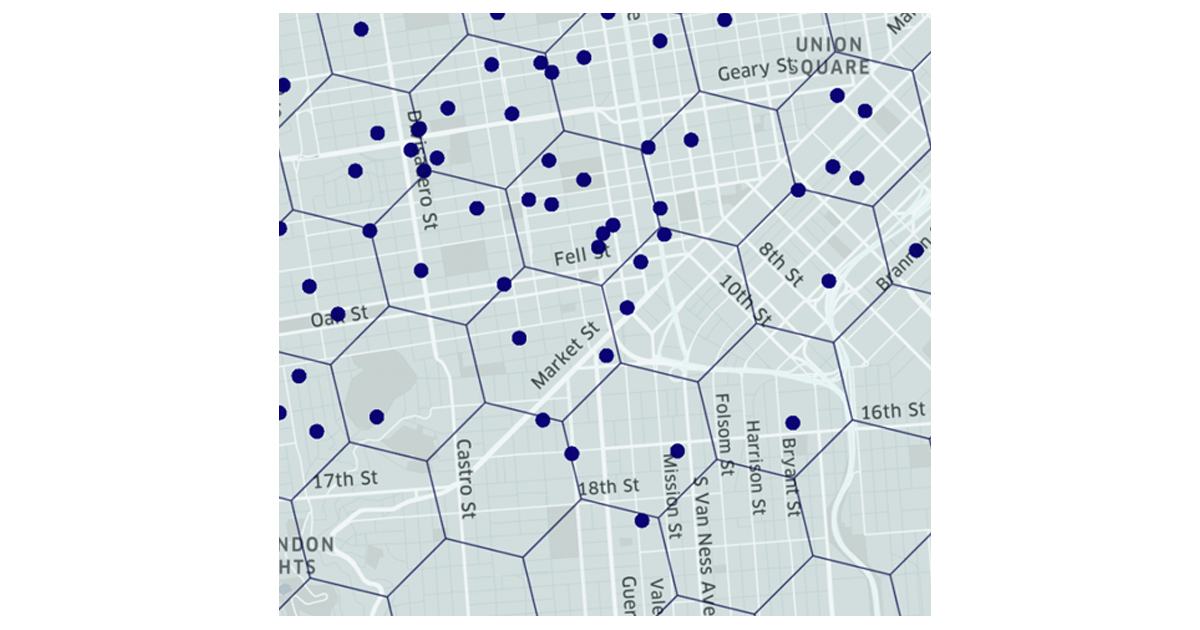
Another approach is to use a more complex (but at the same time more precise) grid system. Grid systems enable data analysis to abstract the messiness away from large-scale data sets for easy mathematical computations. A good example of this is Uber's H3 Hexagonal Hierarchical Spatial Index. Geographical areas can be analyzed according to the cells (or hexagons in this case) in them.
Location can also have a more indirect impact. According to Inman, when it comes to location these are the three main indicators:
- The quality of local schools
- Employment opportunities
- Proximity to shopping, entertainment, and recreational centers
Nowadays, it's possible to know the quality of local schools or proximity to businesses using data from services such a Google Places, Yelp, or SchoolDigger. You can get detailed information, such as businesses' status, price level, nearby schools along with their rating, and more.
This Harvard economist's study found that Yelp data can help understand how the mix of businesses changes in gentrifying areas and how changes in the business landscape can predict which neighborhoods are gentrifying.
The advantage of these services is that data is available in real-time (known in Economics as "nowcasting"), long before detailed public statistics become available.
Using images
As the saying goes, an image speaks more than a thousand features. Or was it words?
When people want to buy or rent a house, they can normally visit it and get a visual impression. Some of the things one might notice, such as the prestige of the neighborhood or how safe or busy a neighborhood feels, can be hard to grasp by a Machine Learning model. These attributes are usually disregarded because quantifying visual appeal is a nontrivial task, heavily influenced by human bias. Moreover, manually collecting such data is both costly and subjective.
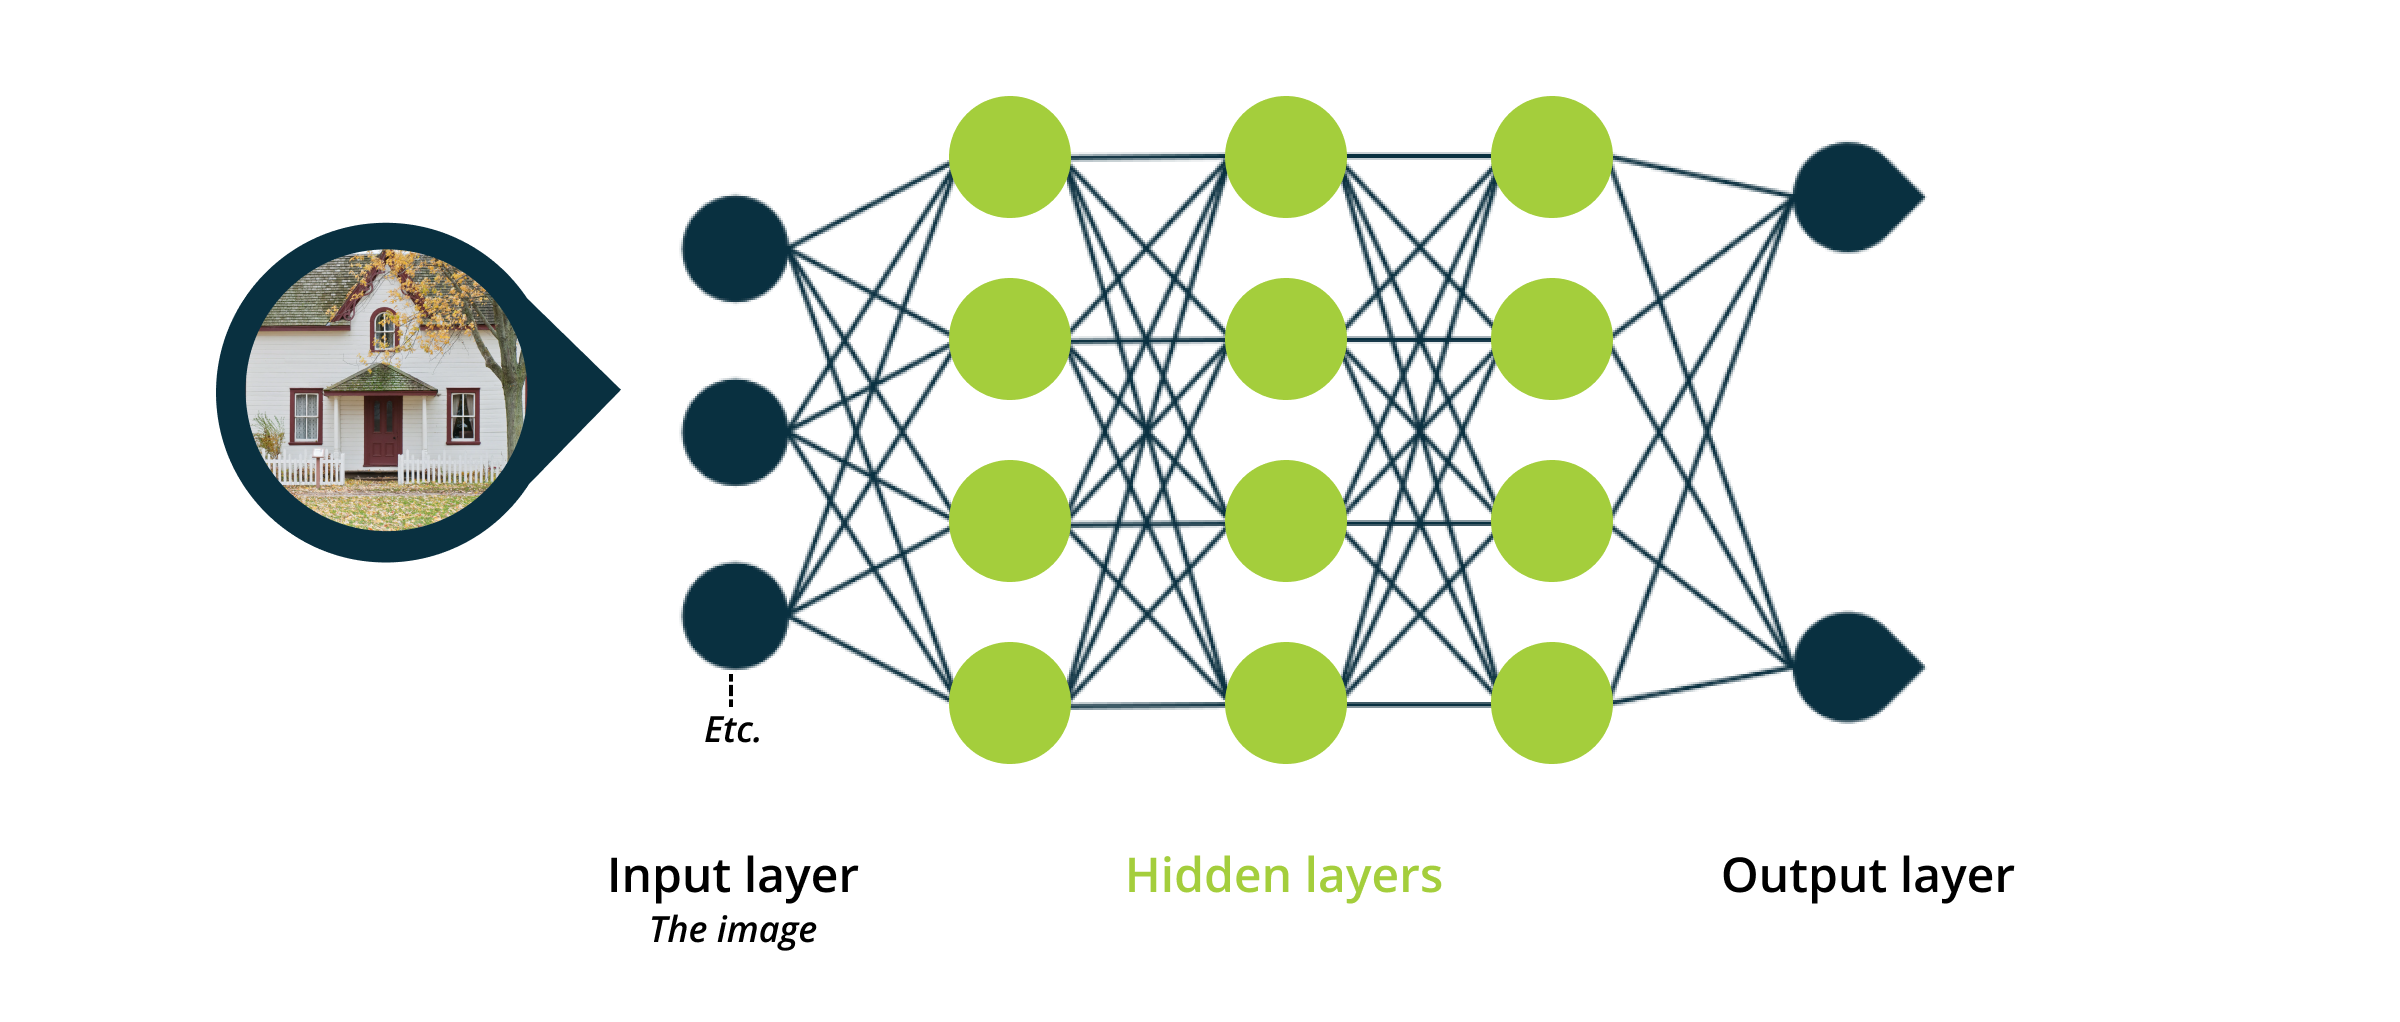
Here's where deep learning models come into play. Architectures such as Convolutional Neural Networks (CNNs) can extract visual features, revealing underlying information captured in photos.

Examples of features directly observable from photos are:
- the activeness of a street frontage
- accessibility of the area (number of roads, condition of the roads)
- amount of urbanization
- proximity to parks, lakes and beaches (recreational areas)
- amount of greenery
- population density
It is possible to leverage satellite images to encode this additional information. They can be obtained using different zoom levels to capture the general (neighborhood) and local (street) surroundings of the property.
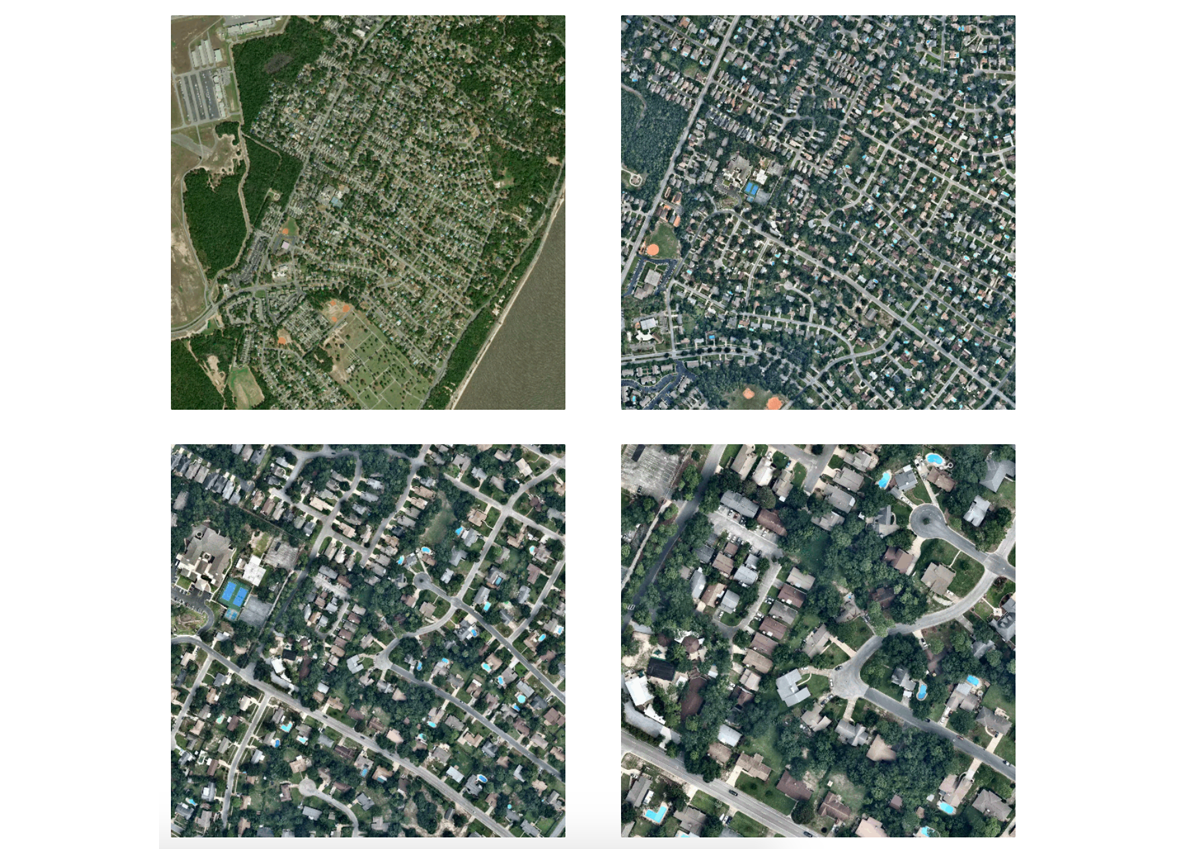
For instance, we built a classification network to distinguish between the top and bottom 15% of houses in a dataset to test this. The model achieved an outstanding 91% accuracy, using only satellite images. After interpreting the model to understand which visual patterns governed its decision process, we saw that it placed high importance on recreational areas such as parks and lakes. This result proves that we can exploit satellite images to gain a deeper insight into the house's surroundings.
Moreover, we can interpret the model to understand which visual patterns govern its decision process. In the images above, the model places high importance on recreational areas such as parks and lakes (top left). As we get closer to the ground, it pays attention to the spatial structure of the roads and houses.
On the other hand, street-level images describe the relationships between urban physical attributes and socioeconomic environments:

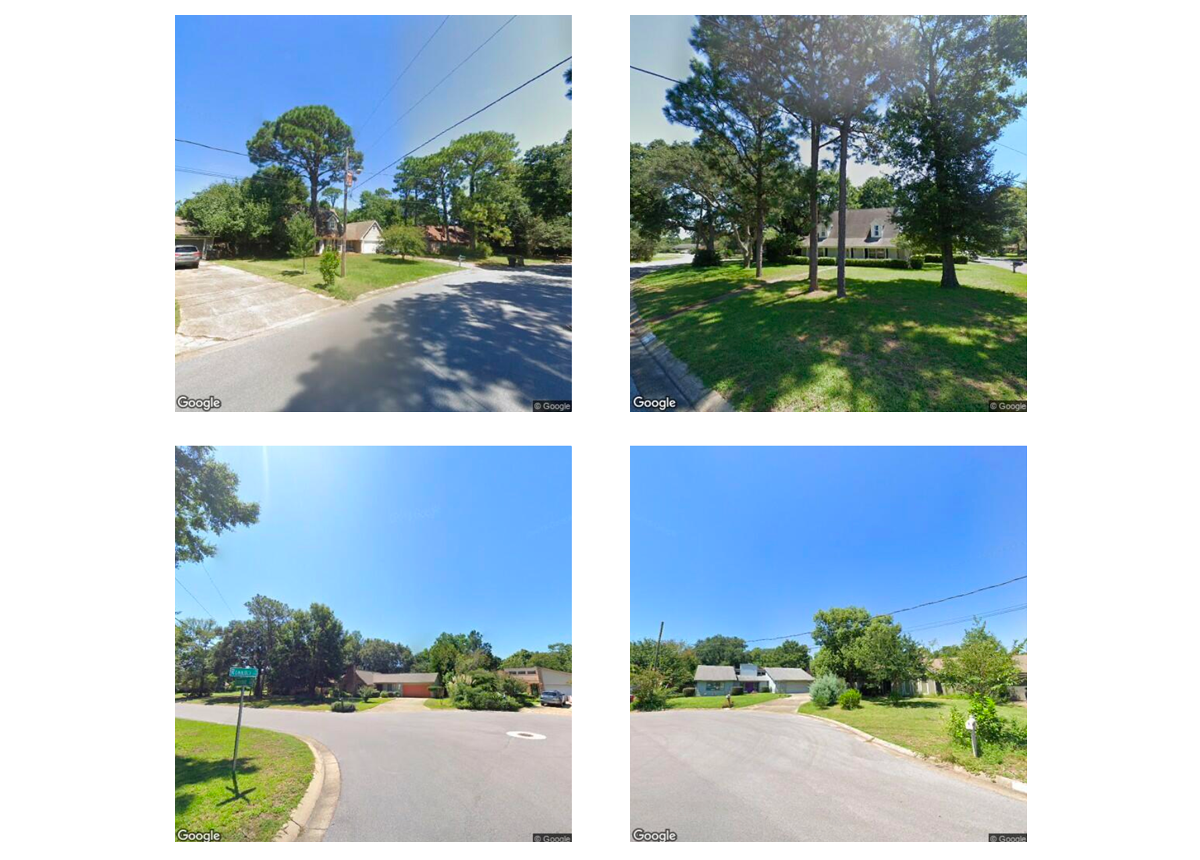
Street View images from the same location in four different directions.
It's undeniable that these images contain rich information about the appeal of a particular area. Leveraging this kind of data could enhance existing models to levels never seen before.
Finally, other types of photos can be used, such as exterior frontal images and interior photos. Such photos provide useful information and other visual features from which the model can learn. For example, indoor photos indicate the property's luxury level, known to impact the price. Also, topography near the house affects the property's worth. Expensive houses tend to be close to the water (lakes, ocean, etc.) or the mountains. Having a view doesn't hurt either. Topographic maps capture this by representing elevation and hydrography.
Applying Natural Language Processing
We can naturally compare standard property features (number of bedrooms, number of bathrooms, etc.). On the other hand, we cannot compare house descriptions in such a way because they are written in natural language text. This is where Natural Language Processing (NLP) comes into play. NLP is a subfield of Artificial Intelligence that deals with human language. NLP models identify meaningful words in a description, for example:
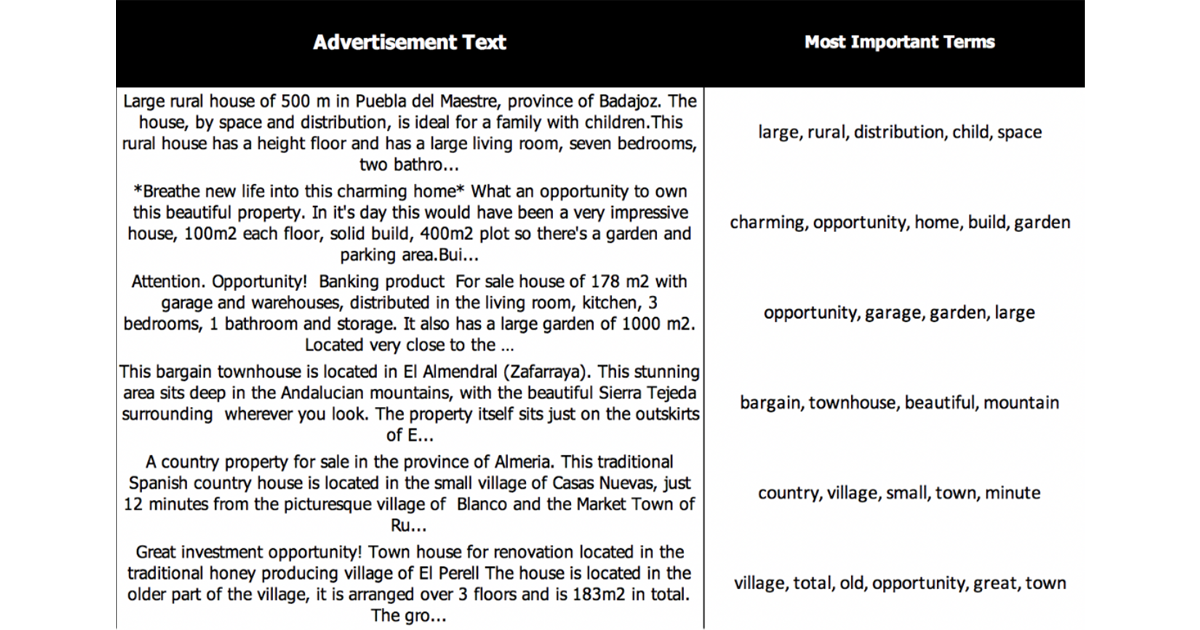
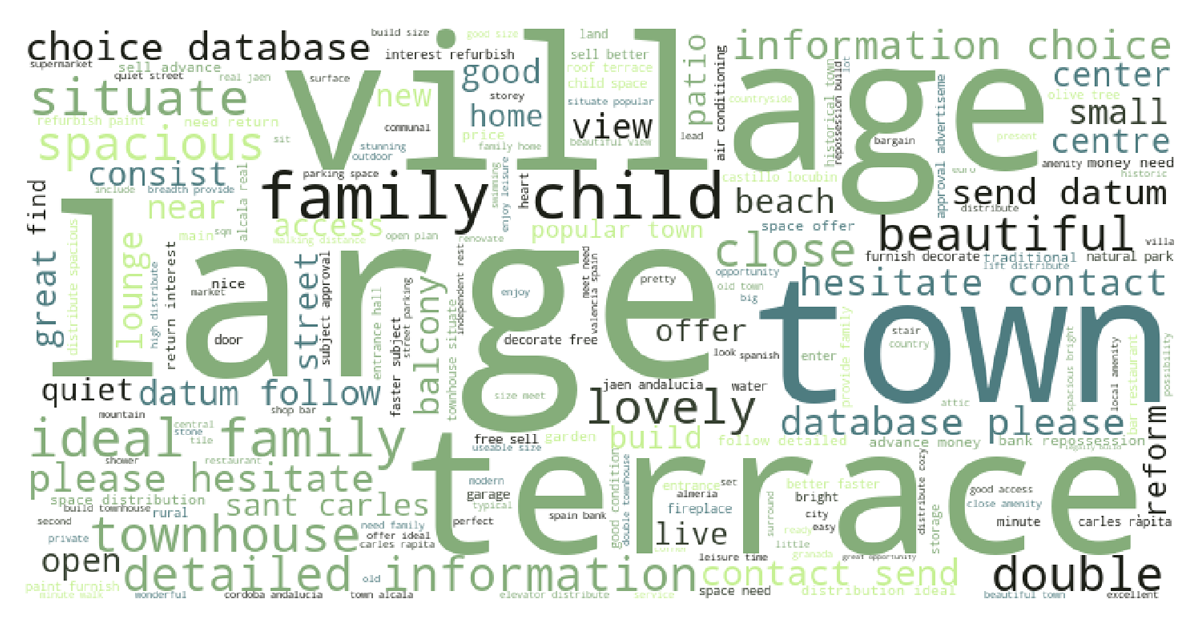
After identifying relevant words, they learn which words tend to be used to describe more expensive or affordable houses. For example, this experiment studied Murcia (Spain) properties and created word clouds with the most common words amongst the descriptions. Here are some terms describing 5% of the cheapest properties:
In contrast, terms describing the top 5% most expensive properties were:
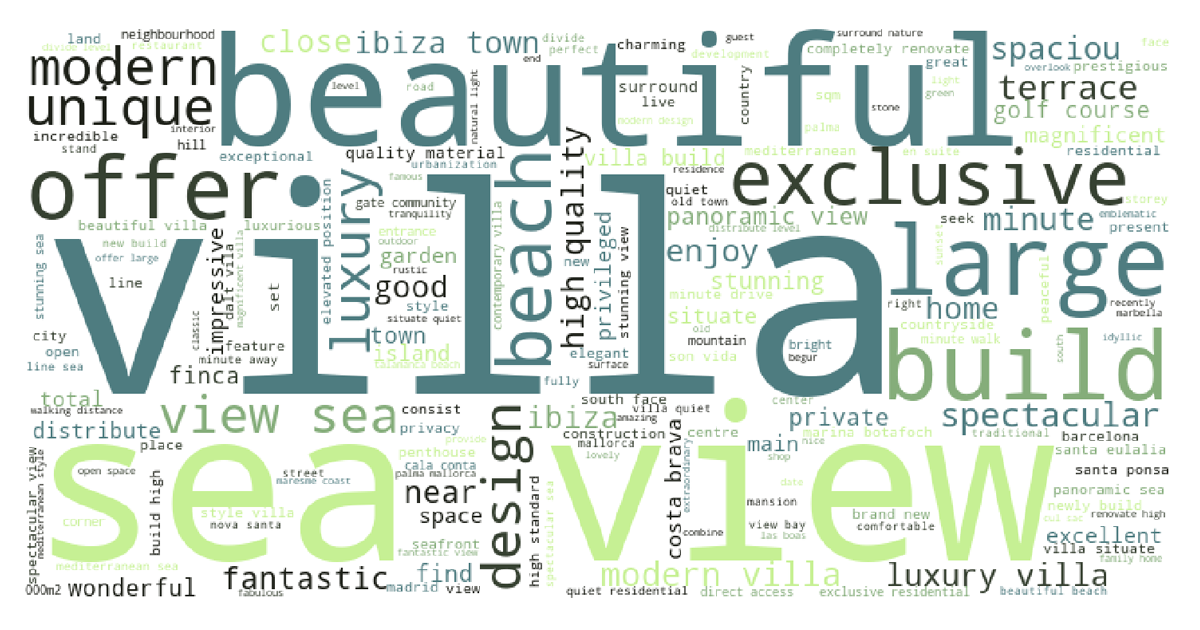
It's not surprising to see "beautiful" as a prominent word in cheap and expensive houses. After all, who is willing to buy a house described as ugly?
The beauty of having different sources of information is that they can complement each other to depict a property better. For example, the algorithm can detect that a house has an overview of the sea using the description, satellite images, or topographic map.
Incorporating sociodemographic variables
Sociodemographic data provides valuable insight into the quality of life in a certain neighborhood. As you might expect, indicators such as the median household income or the poverty level strongly influence the price of a property.
Two main challenges must be overcome when incorporating this kind of data. The first one is choosing the right granularity (for example, state-level versus county-level). We need these indicators to be local enough to capture the vicinity of the property yet regional enough to consider the bigger picture. Choosing too large of an area may lead to inaccurate metrics that misrepresent the house's context.
The second challenge is choosing suitable sources to obtain the data. If possible, your top priority should be official government sources. These provide the most consistent, unbiased, and up-to-date indicators, with the largest sample sizes. The government often relies on this data to make critical decisions, such as how and where to spend federal income. Their dependence on this data says a lot about the data's relevance and credibility.
Examples of useful variables are:
- Income
- Unemployment rate
- Ethnicity
- Number of inhabitants
- Average age
- Poverty level
How to handle all this data?
It's important to design an approach that is fed with data from various sources. Only then does it makes sense to apply state-of-the-art Machine Learning techniques to real estate problems, such as price estimation.

Our solution is not plug-and-play. It is a work in progress, which we fine-tune according to the characteristics of the problem to be solved. For example, when predicting a rent price, we must consider the period (temporary, annually) and if the property is furnished or not. These factors become less important if the task is to predict the selling price. In that case, other variables come into play.
Rental price prediction in Florida
We had the chance to evaluate the impact of nontraditional data on price prediction by ourselves. The project consisted of predicting the rental price of single-family houses in Florida. After an initial scraping phase, we ended up with a dataset of around ~6,000 houses, which consisted of the following features:
- Number of bedrooms
- Number of bathrooms
- Living area
- Number of stories
- Year built
- Furnished/not furnished
- Fireplace/no fireplace
- Heating/no heating
- ZIP code
- Latitude and longitude
We knew right away that we wanted to explore different ways of incorporating the location data. After some internal discussions and exhaustive literature reviews, we chose the image and demographics data path. So, where did we get this data?
Let's start with the easy one: images. It's worth mentioning that we were also interested in predicting the price of non-existing houses (i.e., how good of a return can I get if I build this house in this location). In this scenario, we couldn't use photos of the house itself. Instead, we resorted to satellite images.
Incorporating images at different zoom levels enables the model to learn both regional and hyper-local patterns. In the example below, the farthest image (top left) captures both the surrounding vegetation, a nearby beach, and even a large park. As we get closer to the ground, we identify more detailed information, such as the number of roads and their condition and houses with pools.
To obtain these images, we used Mapbox's Satellite API. This API allows you to query any location by its latitude and longitude coordinates, then select from 20 different zoom levels. And the best part? Mapbox offers 50,000 free requests each month.
On the other hand, the demographic variables can be a little bit tricky. As we mentioned earlier, having a reliable source is crucial for this approach to work. Metrics from dubious sources do more harm than good.
Since our problem is located in the United States, there's no better source for demographic data than the American Community Survey (ACS). The ACS issues monthly surveys to gather information about people's income, education, employment, housing, and health insurance. The government later uses this information to understand local issues and conditions and decide how more than $675 billion in federal and state funds are distributed each year. Here's an example of some of the metrics we obtained:
- Total population
- Total employed population
- Median household income
- Population with income below poverty level
- Minority percentage
- Vacant housing units for rent
- Median value for all owner-occupied housing units
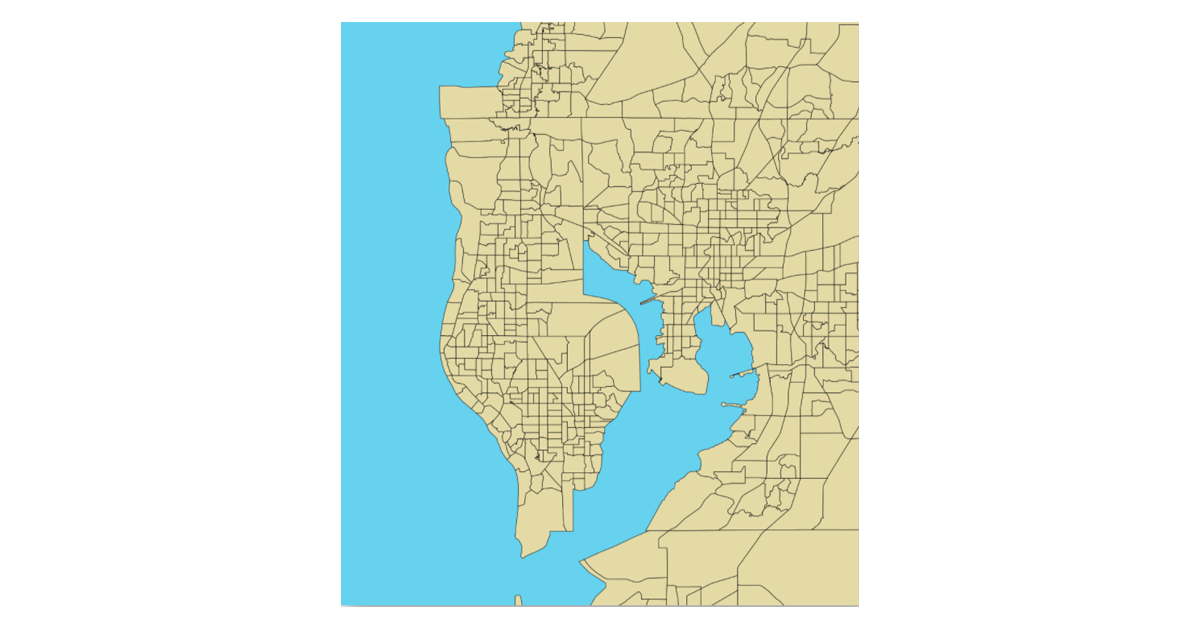
Moreover, most of these metrics are measured at the census tract level. Census tracts are small subdivisions of a county (around 4,000 inhabitants on average), designed to be relatively homogeneous units concerning population characteristics, economic status, and living conditions. In order words, they possess just the right amount of granularity that we want.
The evidence showed that indicators such as minority percentage, median household income, and population median age turned out to be relevant features for the machine learning model. It is worth noting that variables such as minority percentage and poverty level might introduce bias into the model, generating predictions that negatively affect minorities. This is part of a larger discussion related to ethics in AI and it is beyond the scope of this post.
The following heatmaps show how some of the metrics vary amongst census tracts:

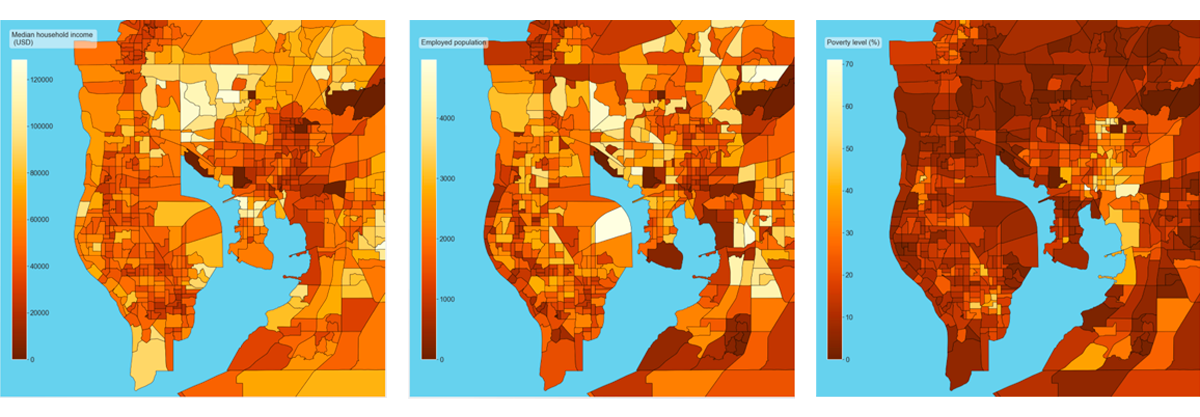
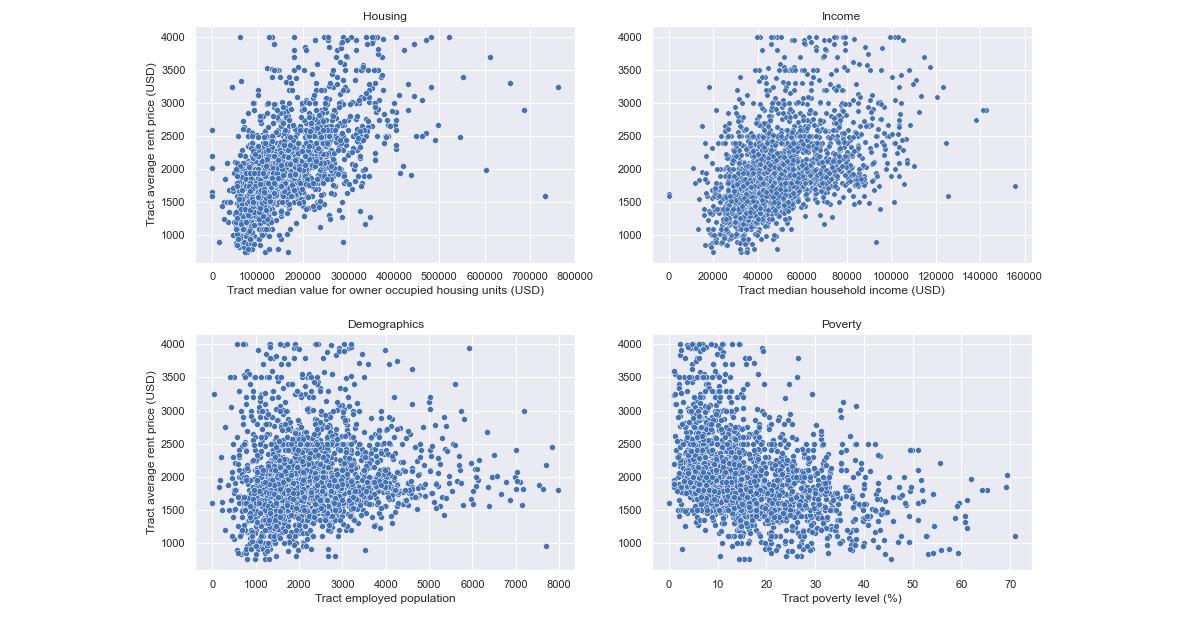
The heatmaps confirm that the data successfully captures the locality of different socioeconomic phenomena. We can explore the correlation between these variables and our target variable.

Final comments
Many of the ideas presented here seem to improve the results of more traditional approaches, and others have yet to be explored. There is no doubt that Machine Learning adds value to many sectors and industries, and real estate is no exception. Fine-tuning strategies like price prediction for specific cases lead us to explore new ways to approach different data sources.
One of our most recurrent statements is providing innovative solutions to usual and repetitive issues requires input from the experts. We love to explore new ways of solving issues while applying state-of-the-art technology. To accomplish this, we need a counterpart immersed in the matter. So, it's not only about combining traditional and nontraditional data to our models but mixing insight from experts with our technology experience that brings about exciting findings.
So let's start making magic and explore how to enhance results together. Also, if you want to know more about the current status of our solution, don't hesitate to get in touch.

Wondering how AI
can help you?

Terms and Conditions | © 2026. All rights reserved.