

Automatically measuring soccer ball possession with AI and video analytics


Qatar 2022 World Cup is just around the corner and in Tryolabs everybody is excited to have their national team compete. As the teams prepare for the event, they more than ever rely on AI-assisted sports analytics for inspecting their performance based on both recordings of their previous games and real-time information delivered to the coach during the matches.
AI is being used to identify patterns that lead to success and to compute indicators that give coaches objective numbers over which to optimize to maximize their team’s chances of scoring. One such indicator is ball possession.
Leveraging Norfair, our open-source tracking library, we put our video analytics skills to the test and wrote some code to showcase how AI can compute ball possession by team automatically by watching a video of a match. Here is how it looks in a snippet of a match between Chelsea and Manchester City:
We also made it open source on GitHub. You can inspect every single part of the code, and use it as a base to build something else!
In this post, we are going to dig a bit deeper into what exactly ball possession is, explain how this system was built from simpler components and how these work.
Defining ball possession
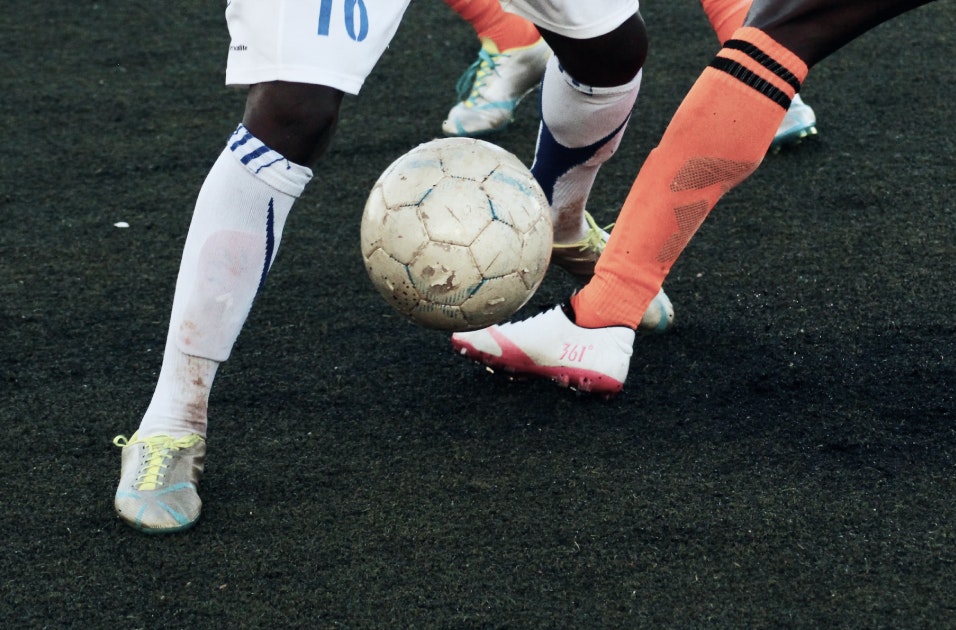
Ball possession is one of the most important statistics in a soccer game. According to a 2020 study conducted over 625 UEFA Champions League matches, teams with more ball possession won 49.2%, drew 22.0%, and lost 28.7% of the matches overall, exceeding the winning rates of their rivals. This effect was even greater when the gap of ball possession percentage between two teams in a match was higher.
There is definitely something in this number. The team with a higher possession is more likely controlling the match.
| Season | Matches | Won | Draw | Lost |
|---|---|---|---|---|
| 2014/2015 | 124 | 65 (52.4%) | 28 (22.6%) | 31 (25.0%) |
| 2015/2016 | 117 | 53 (45.3%) | 21 (17.9%) | 43 (36.8%) |
| 2016/2017 | 119 | 58 (48.7%) | 32 (26.9%) | 29 (24.4%) |
| 2017/2018 | 120 | 59 (49.2%) | 25 (20.8%) | 36 (30.0%) |
| 2018/2019 | 119 | 60 (50.4%) | 26 (21.8%) | 33 (27.7%) |
| Total | 599 | 295 (49.2%) | 132 (22.0%) | 172 (28.7%) |
We now know how important ball possession is to soccer analytics. But what exactly is it? How is it computed? There are actually two methods that yield different results.
Method 1: based on calculating passes
The first method is to consider ball possession in relation to the number of passes. The possession metric would be the number of passes on each team during the match, divided by the total number of passes in the game.
While straightforward to compute if counting passes manually (with a clicker), this method has a big drawback: it doesn’t account for the total time that players have control of the ball.
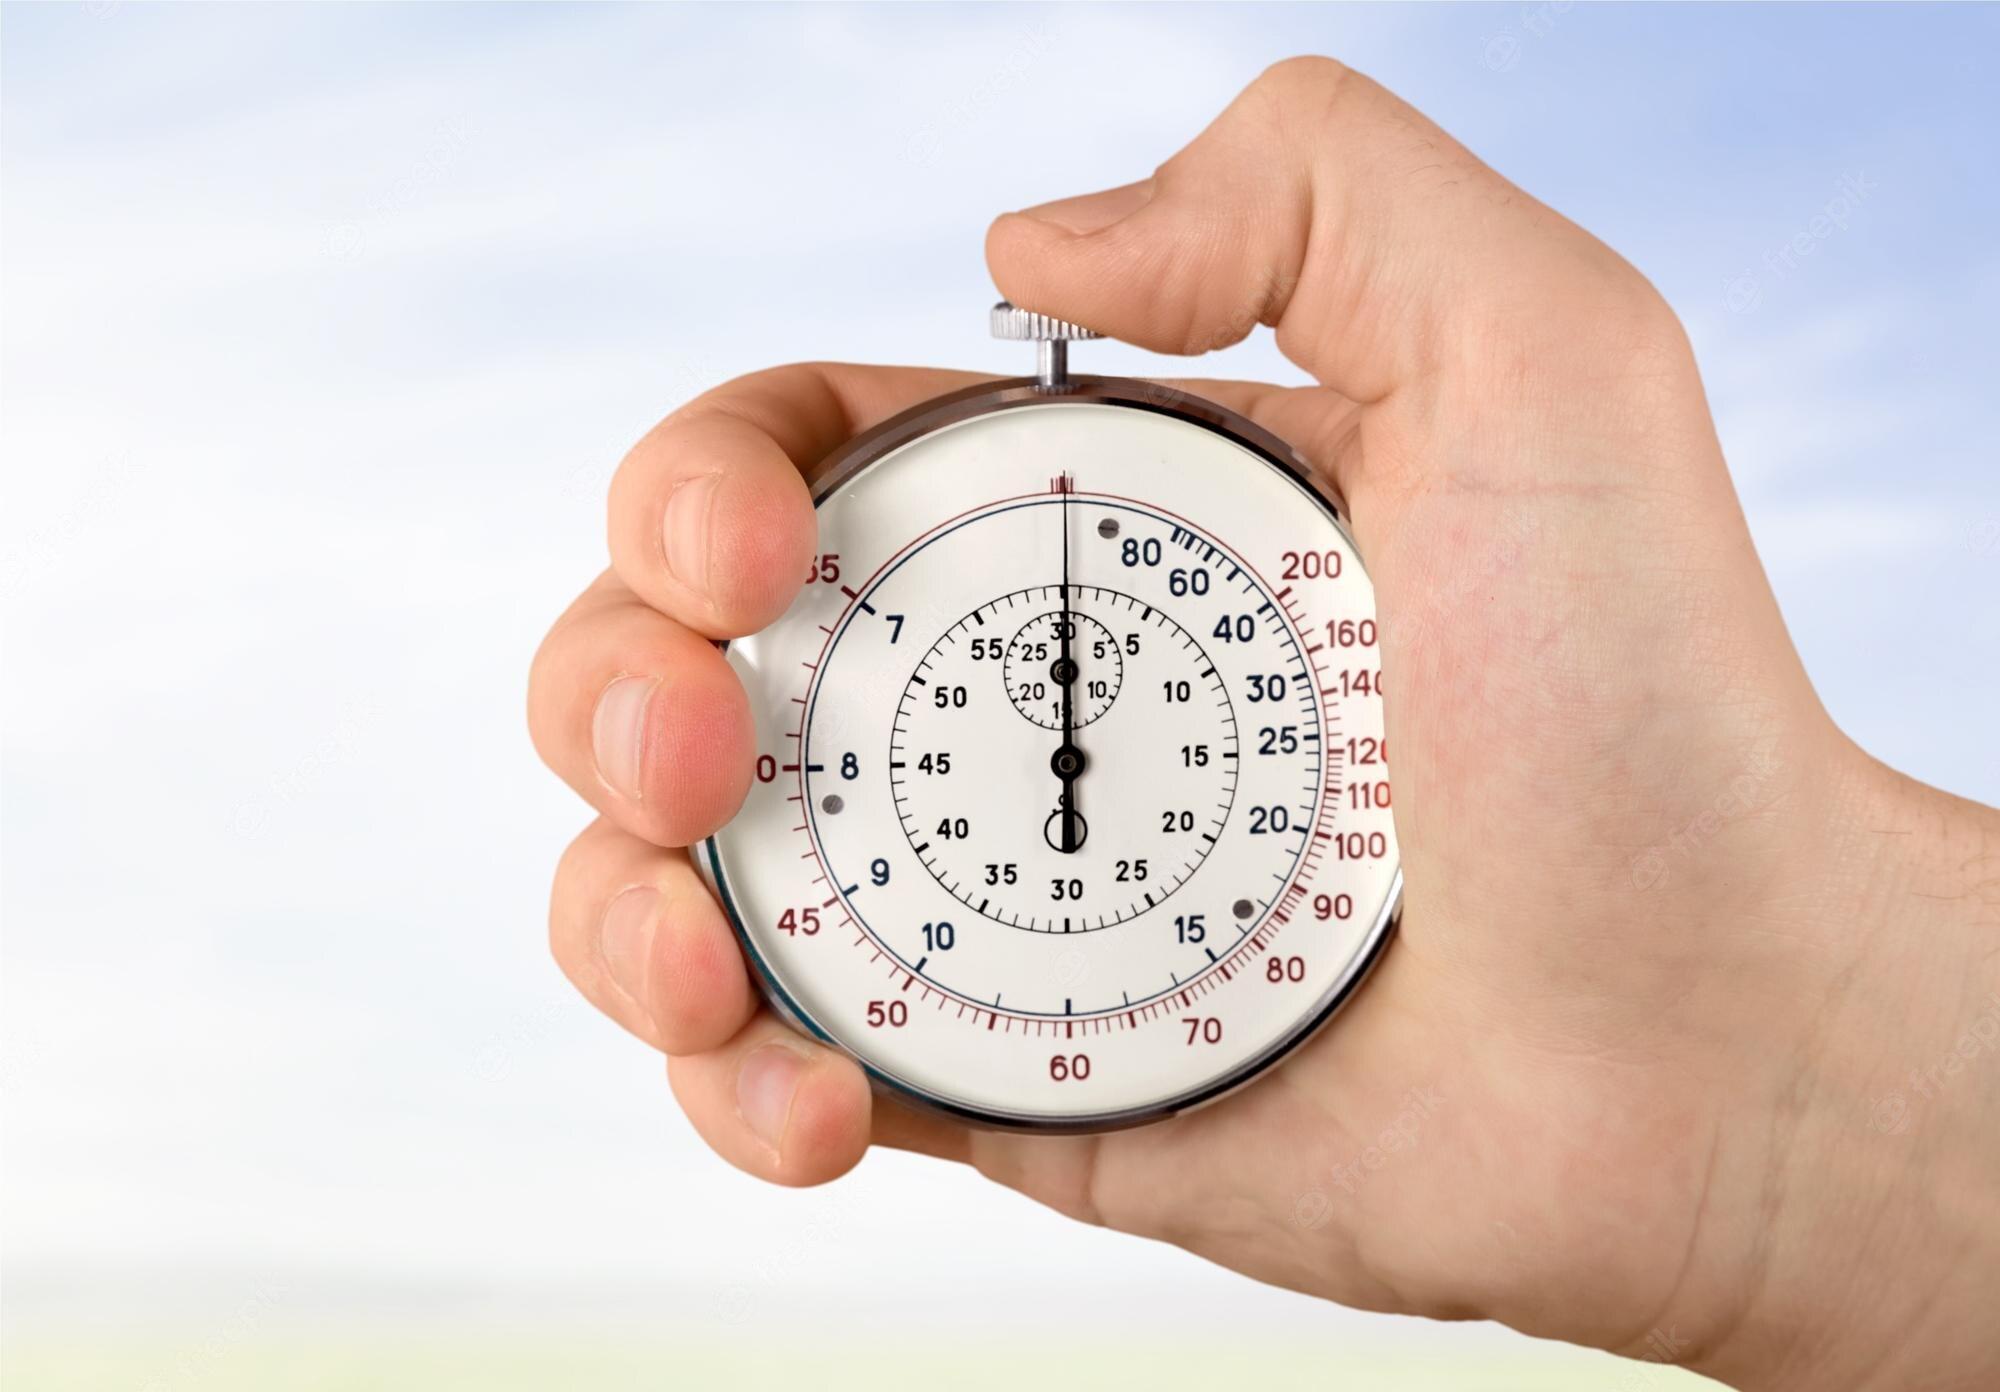
Method 2: based on time
Another method that is widely used consists of controlling a clock manually for each team. A person has to be in charge of starting a timer when a team gets a hold of the ball and stopping it when they lose it. The timers also need to be paused when the game is stopped. While accurate, this approach needs the scorekeeper to be very focused for the duration of the game. It’s also susceptible to human errors. Forgetting to turn on or off the clock can mess up the metrics (and you don’t want that!).

Using AI to compute ball possession
Do we really need to burden someone with this task in this day and age?
Turns out that with deep learning and computer vision techniques it should be very feasible to automate this. For the remainder of this post, we will understand ball possession as the % of the time that each team has the ball (method 2).
In a nutshell, we will build a clock powered by AI instead of a human.
Divide & conquer: the steps
Let’s start by breaking down the problem. We are going to need to:
- Get a few videos to test.
- Detect important objects.
- Detect the players.
- Detect the ball.
- Identify each player’s team.
- Determine which player has the ball at all times.
There are also some “nice to haves”:
- Drawing the trailing path of the ball during the match (for better visual inspection, remember we are doing sports analytics here!).
- Detecting and drawing passes completed by each team.
Now that we know what we need to do, let’s see how we can develop each step.
Step 1: Getting a few videos to test
There is no better way to test our algorithm than on live soccer footage videos. However, we can’t just use any live soccer footage video, we have to be sure that the video does not change between different cameras. Fortunately, this can be easily accomplished by trimming a live soccer match from Youtube.
We searched for a few matches with different teams to test our project in different situations. We are going to test our project in the following matches:
Step 2: Detecting objects
What is a soccer match without players and a ball? Just a referee running from one side of the field to the other 🥁.
It’s crucial to know the location of the players and the ball before ever thinking about calculating the ball possession. To do this, we need two deep learning models: one for detecting the players and another for detecting the ball.
Detecting players
What would have been a challenging problem a decade ago is nothing but a few lines of code in 2022. There are multiple pre-trained models we can use to detect people. In this case, we will use YOLOv5 trained in the COCO dataset. This will get us bounding boxes around each player, and confidence scores. Here are the results:
Detecting the ball
The COCO dataset has a specific label for sports balls, but the results we got using a model trained using it were not good enough for this type of live soccer footage so we had to come up with a different approach.
In order to improve the results for our specific task, we finetuned the YOLOv5 detector trained in COCO with a specific dataset of balls containing only footage from live soccer matches.
The dataset was created with footage of soccer videos with a similar camera view, and the labeling was made with an open-source labeling tool named LabelImg. The finetuning process was made following the instructions of the official YOLOv5 repository.
Please note that this is by no means a fully robust ball detection model, the development of which is outside the scope of this blog post. Our resulting model mostly works on the videos we used for these demos. If you want to run it on other videos, the model will need more finetuning over labeled data.
Putting things together
Great! We now have two models that we can use as if it was only one model by adding both of the detections. The result is a perfect model for soccer video analytics.
Step 3: Identifying player’s teams
How can we know which team has the ball if we don’t know the team of each player? We need to have a stage that takes the players’ detection as inputs and outputs the detections with their respective classifications.
Here, there are several approaches we could follow, each one with its pros and cons. In this section, we will restrict ourselves to two simple ones and leave out more complex techniques such as clustering, siamese networks, or contrastive learning (we encourage you to try these, though!).
Approach 1: Neural network based on jersey
One approach is to train a neural network for image classification based on the team's jersey. The dataset can be generated by running a video with a player detection model and saving the crops of the detections as a dataset for training. The labeling can be easily done from a Jupyter Notebook with a tool like pigeonXT.
A neural network could be a good approach when there are complex scenarios to classify. For example, to distinguish between jerseys with similar colors. Or when there are occlusions of players. However, this advantage comes with a cost. This approach requires you to create a dataset and train the model for every match that you want to analyze. This can be daunting if you would want to be able to analyze the ball possession in many different soccer matches.
Approach 2: Color filtering with HSV
As in most sports, different teams are expected to use easily distinguishable jerseys for a match, so what if we can leverage that information using some classical computer vision?
Let's take an example of a match between Chelsea and Manchester City. Here we have four distinctive colors:
| Classification | Jersey Color |
|---|---|
| Chelsea player | Blue |
| Manchester City player | Sky Blue |
| Chelsea Goalkeeper | Green |
| Referee | Black |
Note that there is no color for the Manchester City Goalkeeper. This is because his jersey is black, and would therefore have the same color as the referee's. We didn't claim this approach could cover every single case :)
For each color, we created an HSV filter that will tell us how many pixels of that color the image has.

The reason we chose to filter with HSV values instead of RGB is that HSV filtering is more robust to lighting changes. By adjusting only the hue value, you are choosing what type of color you want to keep (blue, red, yellow, etc), independent of how dark or light the color is.
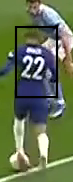
Before filtering the colors, the player image is cropped in order to keep just the jersey. The crop is a specific percentage of the image. This helps to reduce unnecessary information for the classification algorithm. For example, in this image taken from a bounding box, the cropped image removes most of the pixels of the unwanted player, but still keeps most of the information of the desired one.

For each color range, we created a filter that keeps the pixels in the color range and sets the rest to black.
The cropped image is then fed to the 4 color filters specified before. The output of the 4 filters is then passed through a median blur filter that will be in charge of removing unwanted noise.
For each output, we count the number of pixels that passed through the filter (i.e. the non-black ones). The filter with the highest count will give us the team that represents the player!
The following animations show the described process:
If a team has more than one color, the sum of the non-black pixels of all the corresponding colors will be taken into account for the comparison.
For more details on how the classifier is implemented, please take a look at this file.
Improving classification with inertia
Our HSV classifier works well… most of the time. Occlusions and imprecisions of the bounding boxes sometimes make the predictions unstable. In order to stabilize them, we need tracking. By introducing Norfair, we can link players’ bounding boxes from one frame to the next, allowing us to look not just at the current team prediction but past ones for the same player.
Let’s see Norfair in action:
It’s common sense that a player shouldn't be able to change teams across the video. We can use this fact to our advantage. Therefore, the principle of inertia for classification states that a player's classification shouldn't be based only on the current frame but on the history of the previous classifications of the same object.
For example, if the classifier has set inertia equal to , the player classification on frame will be decided by the mode of classification results from frames to . This ensures that a subtle change in the classification due to noise or occlusion will not necessarily change the player’s team.
Ideally, infinite inertia would be great. However, the tracker can mix some ids of the players. In this case, if inertia is too large, it can take too much time for the classifier to start predicting the correct team of the player. An ideal value of inertia is not too big or small.
Here are examples comparing the HSV classifier with and without inertia:
Step 4: Determining the player with the ball
This is the final piece to our computation of ball possession. We need to decide who has the ball at all times.
A simple method works by determining the distance from all the players to the ball. The closest player will be the one who has the ball. This is not infallible of course but mostly works fine.
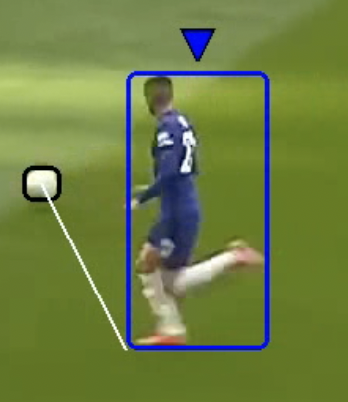
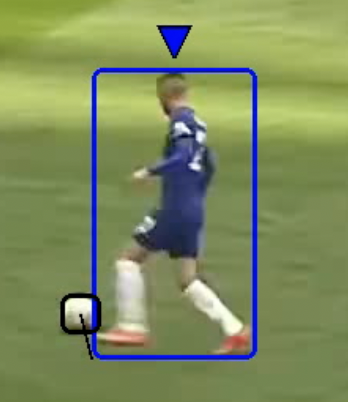
For our demo, we defined the distance as the distance from the closest foot of the player to the center of the ball. For simplicity, we will consider the bottom left corner of the bounding box as the left foot of the player, and the bottom right corner of the bounding box as the right foot.

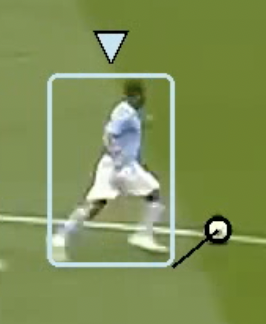
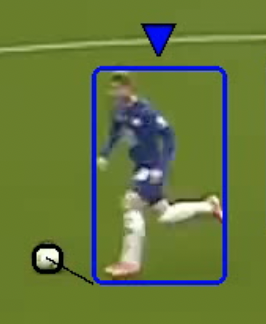
Once we know who the closest player to the ball is, we have to define a threshold to know if the player is near enough to the ball to be considered in possession of it.

From models and heuristics to possession
We now have everything that we needed in order to calculate the ball possession metrics. However, determining which team is in possession of the ball is not as simple as stating that it's the team of the player that has the ball in each frame. As with our team classification process, the algorithm for ball possession should also have some inertia.
In this case and given a team with the ball, inertia states how many consecutive frames the players from the other team should have the ball for us to consider that the possession changed. It’s very important to consider consecutive frames. If there is an interruption, the inertia restarts.
Without inertia, the possession will change unnecessarily in events such as a rebound, or when the ball passes near a player that didn't have the ball.
Making our demo pretty
Thanks to the new release of Norfair, we can understand how the camera moves in a specific video. This information allowed us to draw the path of the ball in the exact location of the field even when the camera moved from one side of the field to the other.
We also developed an easy-customizable scoreboard that can be used with every possible team to keep track of the metrics in a fashionable manner.
Our final result with every step together and our custom design looks like this:
Freebie: detecting passes!
Our approach so far can also give us more useful information to analyze a soccer match.
We can define a passing event as when the ball changes from one player to another one from the same team. As we have seen before, we have everything in place for this. Let’s draw the passes and see how it looks!
Trying it on different matches
Here we have results over other video snippets:
Show me the code!
The entire repository is available on GitHub.
Apart from the computation of possession, we also include code for drawing the passes of each team with arrows.
Caveats
It’s important to keep in mind that this project is only a demo with the purpose of showing what can be done with AI and video analytics in a short amount of time. It does not attempt to be a robust system and cannot be used on real matches. Much work remains to be done for that!
Some weak points of the current system:
- The ball detection model that we used is not robust. This can be easily improved by fine-tuning an object detection model on a better dataset.
- The player detection model might not work very well when many players are near each other, especially when there is a significant occlusion.
- The team jersey detection method can be improved.
- Our system breaks if the camera vantage point changes. Most live TV footage usually takes close-ups of players with different cameras.
- Our system doesn't detect special events in the match such as corners, free kicks, and injuries. In these events, the ball possession will still be calculated and there will be a difference between the calculation of the real ball possession and the one calculated with our algorithm. In order to perfect our system, we would need to detect these events and stop the clock accordingly.
Conclusion
Video analytics is a lot of fun, but it’s no magic. With this blog post, we tried to shed some light on how some of these solutions are implemented behind the scenes and release the code for everyone to play with. We hope that you found it useful!
Again, by no means is this a perfect system. Professional development of these tools for sports analytics will likely need to use several high-precision cameras, larger custom datasets, and possibly recognizing the 3D position of the objects for improved accuracy.
When faced with the development of a large system, we might feel daunted. We must remember that every complex system starts from simple components.

Interested in video analytics applications?

Terms and Conditions | © 2026. All rights reserved.