

Machine Learning 101: Build, Train, Test, Rinse & Repeat


In the previous episode of our Road to Data Science series, we went through all the general skills needed to become a proficient data scientist. In this post, we start to dig deeper into the specifics of Machine Learning. We start by posing the simple questions: What is Machine Learning? What kind of problems can Machine Learning solve?
What is Machine Learning?
A great way to start understanding the idea behind Machine Learning is to think about what’s new in Machine Learning compared to traditional programming.
So, essentially in traditional programming, we build a machine that outputs a result based on an input and a set of rules. Our job as programmers is to construct the correct set of rules for our system to output the desired result. Thanks to the computer’s ability to follow complex instructions incredibly fast, this approach works very well for a vast set of tasks, from calculating taxes to landing a rocket on the moon.
So, why do we need Machine Learning? Well, machines are great at solving problems that look difficult or tedious to us. For example, imagine computing all the prime numbers up to 10,000,000. On the other hand, another set of problems, including some that seem trivial to us, are very hard to decompose into a set of deterministic rules.
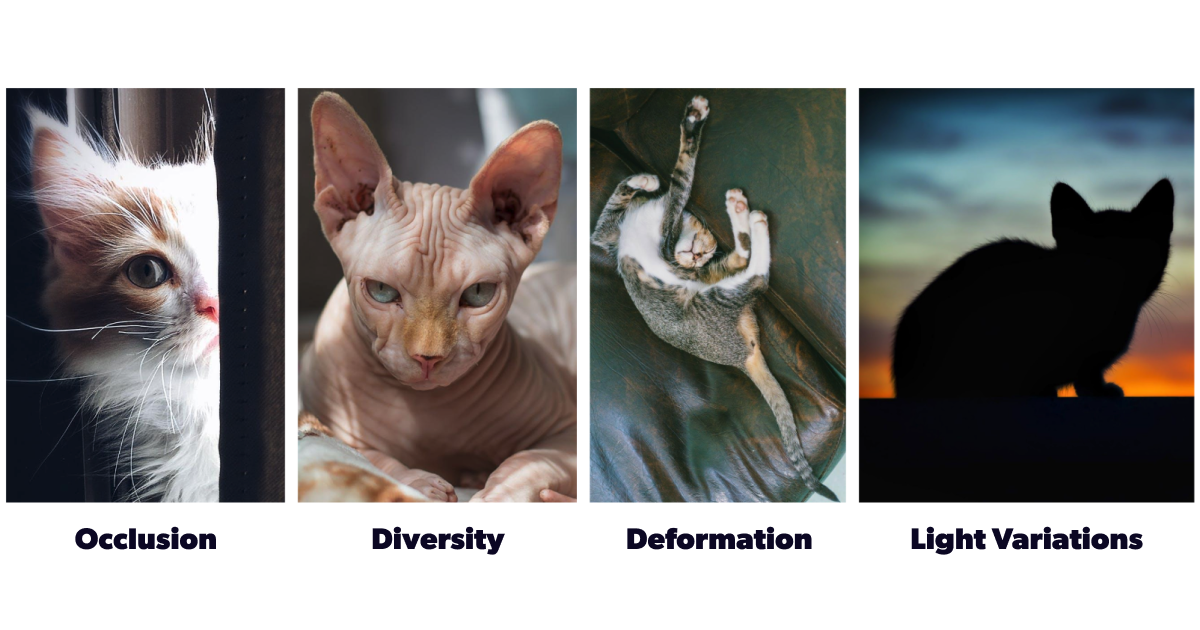
Take, for example, the problem of observing a picture and determining if there’s a cat in it. The problem is trivial for any human, but not for a computer, especially considering all the variations between breeds and all the variations in angle, lighting, positioning, and occlusion. What can we do?

Machine Learning to the rescue! Instead of building an explicit set of rules, Machine Learning systems learn the patterns that go from the input to the output based on observing a massive amount of data. This approach can solve many tasks, from identifying cats in pictures to modeling the consumer purchase decision.
The details of how our Machine Learning system learns these patterns depend on the specific algorithm we are using. These algorithms come in many shapes and flavors. There are whole families of them, but we can generally group them based on a couple of criteria.
If we look at how information is fed to the model, we can broadly classify Machine Learning techniques as supervised, unsupervised, or reinforcement. When labels are fed to the algorithm during training, the method is supervised. When no label is fed, the method is unsupervised. And when the system is allowed to make decisions and gets feedback on them, the method is Reinforcement Learning.
On the other hand, if we look at the kind of task they perform, Machine Learning techniques can be classified into several groups such as regression, clustering, single or multi-class classification, and so on.

Extra readings
- Check this post to learn more about what kind of tasks can be solved using Machine Learning.
- Microsoft has a very comprehensive and extensive set of courses for beginners, one called ML for beginners and the other one called Data Science for beginners, be sure to check them out!
A Shopping List to Machine Learning
If you had asked us 15 years ago what skills you needed to apply Machine Learning, our list would have included an endless list of mathematical, computer science, and statistical knowledge that could have discouraged even the most audacious.
Today, thanks to the cumulative contributions of many in the Machine Learning community, the field has become much more approachable. Anyone who wants to do Machine Learning today stands on the shoulders of giants.
In fact, you might have heard that doing Machine Learning these days is as simple as writing a few lines of code. Well, the rumors are true, but that's only a fraction. Let's see that for ourselves.
Say you were walking the countryside when suddenly you felt the unrelenting urge to differentiate the subspecies of a particular type of plant: the iris.


You could take a picture of every iris flower you encounter and send it to your taxonomist friend or try to learn the pattern that goes from the dimensions of the flowers to their species. In Python, this looks like this:
Boom! Problem solved with 96.7% accuracy in unseen data! Next time you see an iris, you can measure its flower and ask your model to predict the plant’s species. Now, you might be looking at this unfamiliar code and wonder: Is it possible to learn this power? Or, if you’ve been following along our blogposts and are already familiar with Python, you might wonder: What if I want to do something slightly more complex? What tools do I need? Where do I find the resources? Don’t worry; we’ve got you covered. We’ll walk you through the Machine Learning pipeline step by step, referring you in each step to all the relevant material you need.
1. Get Raw Data
Unless you’ve been living under a rock during the last decade, “Data is the New Oil” is a headline you have seen several times. No wonder companies are so protective and private about their data - a lot of potential is there waiting to be exploited!
Does this mean that you can't access any interesting datasets? Well, if you are solving a novel or a very niche problem or maybe need a specialist like a doctor to tag medical images, you will likely need custom data and a custom process. But for simpler cases or educational purposes, the community has put an enormous effort into having publicly available and preprocessed data. What a time to be alive!
Suppose you want to take a look at some curated datasets. To name just a few, you can check the COCO dataset for image segmentation, the ImageNet dataset for image classification, and Kaggle's Datasets for an extra wide variety of problems, from used car prices to a brain stroke prediction dataset.
Once you get your hands on your precious data, what's next? It depends on what kind of data we’re talking about and its degree of “rawness.” Are you dealing with images? Text? Is there a database (lucky you!)? Do you have a CSV (or JSON, or, God forbid!, XML)?
In any case, you need to be able to handle all these kinds of data and clean, tag, and transform it to your needs. You need to cook that raw data that you just got. For that purpose, let's jump to the next section called “Cook Transform Data.”
Extra readings
- Luminousmens article on data file formats and their comparative advantages.
2. Transform Data
Once we have the data, we need to move it, change it, stretch it, and bend it to our will. Unless the dataset is very small, this requires some sort of programming.
There are many kinds of data, each requiring a different set of skills. We could mention images, videos, and text as popular data sources. However, for this blog, we will focus on the data type that (probably) rules them all: tabular data.
A tabular dataset is basically a spreadsheet where each row is a new sample, and each column represents some information about those samples.
Manually changing things in spreadsheets is easy, albeit time-consuming, and usually unfeasible for large datasets. The equivalent way to manipulate tabular data in Python is with Pandas, the most widely adopted library for table manipulation in Python and one of the most popular libraries in the language.
If you are serious about doing Machine Learning in Python, you must learn Pandas. Luckily, there are many great resources available to help you learn.
Essentials
- As a starting resource, this Kaggle tutorial is a must.
- Further, we recommend Towards Data Science’s blog post on writing simpler and more consistent Pandas code.
- For a hands-on guide from Pandas basics to its most important features, you can check our blog post on the subject.
3. Pick a Machine Learning model
There are several ways to think about Machine Learning models. In the vignette below, XKCD summarizes quite well one of the most common ways people see Machine Learning models.


But, we prefer a different way to think about them.
We think of a Machine Learning model as a coffee machine where you put coffee beans and water in and get magic on the other side. Even though making coffee is fairly easy, each coffee machine has its own way of working. If you are brewing coffee with a French press, you need a coarser grind, whereas if you use pour-over brewers, the grind needs to be much finer, almost finer than sand.
Similarly, we can think of Machine Learning models as machines. When given data (coffee beans), they output predictions (coffee/magic). We must be careful, though, because different models require different inputs. Some models require all data to be “very granular” (normalized between [0, 1]), while other models accept arbitrary numbers. Almost all models require the input to be in a numeric format, neither text nor images.
Under this way of viewing Machine Learning, the most important task for working with a model is reading and understanding its instruction manual: dust or coarse, normalized or not, linearly independent or not, and so on.
But before turning the grinder on, it is wise to check if the coffee beans come with stones or dirt mixed in the same bag because you don't want to include them in your cup. That's why you will have to spend time separating good beans from dirt. The same is true for data: not every attribute will be useful, and maybe most will not. Looking at the data and deciding what will be useful for the model and what will not is often referred to as data cleaning and is a crucial part of Machine Learning.
Once you have your coffee ground, you may want to make a special blend choosing different origins of the beans. The reasons for blending can be many. You may want to bring more complex flavors or reduce the price of the package while maintaining the quality. The same goes for data. Depending on your model, you may want to transform a variable to have a normal distribution or help the image classification by tweaking the color balance of the images. This process is called feature engineering and is arguably one of the hardest parts of Machine Learning. As shown above, getting predictions from a Machine Learning model takes only one line of code, while a data processing pipeline can be several hundred —if not thousands— of lines long.
There is a myriad of resources out there on how to become a great barista data scientist. If we need to name a few, those would be:
Theory
- Statquest is an amazing YouTube channel to learn about the main ideas behind both specific models and overall Machine Learning concepts.
- A great resource on the theory behind Machine Learning can be found in Stanford's CS299 course. If you plan on taking this course, Garrett Thomas’s math summary might also be useful.
Concepts & exercises
- DataCamp offers a Data Scientist career track with almost 100 hours of hands-on courses on data manipulation and classic Machine Learning algorithms.
4. Get the model to learn what you want, not what it wants
Say you wanted to describe the concept of chairs to a friend, so you would start with the chairs you have at home as examples, and you start saying something like "a chair is an item with 4 legs that you can sit on".
At first, you are happy because it describes all the chairs at your place, but also your bed, your sofa, and a stool. Then you try a more complex description of what a chair is to exclude these other pieces of furniture. So you add more variables to describe your chairs, including color, shapes, or materials; and you come up with something like "has 4 legs, you can sit on it, has a back, it’s made of wood, the legs are brown, the seat is green with this specific pattern". Not a great solution either, is it? Now you can perfectly classify the chairs back at home, but you won't be able to describe your friends’ chairs. You’ve overfitted your definition to the chairs you know.
ML models face the same problem as the person classifying chairs above. Go too simple, and you end up with a bad definition, go too complex, and you might end up just memorizing the data you see. This problem is known in machine learning as the bias-variance trade-off.
Our job as developers is to design our model and its training process so that memorization is not a viable option and the only option left is to learn the relevant patterns. There are several tools that we use for this, and if you’ve been following the courses above, you should be familiar with most of them. The following are some you should definitely know about.
5. Measure results
By now, you should have managed to have your model training for a couple of epochs and are probably wondering if it is doing any good.
To answer that, we need to introduce a new concept: metrics. Let's dig into this topic with an example. Imagine that you are training a model to predict the selling price of a house. You have 500,000 houses. For each of them, you have the real price and the predicted price. How do you check if the predictions are correct?
Since evaluating a model’s performance by looking at its prediction for every single data point is not feasible, we need a way to summarize the performance across all samples to get a single number that we can use to evaluate the model. When using metrics, you have to consider that it comes with a compromise: you will start evaluating things on average.
There are many, many metrics out there. You can even have custom metrics for your needs because not all metrics are well-posed to solve different problems with the same techniques. For regression problems, we have metrics such as MAE, RMSE, and MAPE, while for classification problems, we can use accuracy, f1-score, AUC, confusion matrix, etc. You should definitely get acquainted with their uses, strengths, and weaknesses.


Very specific problems might even require custom metrics for the model to learn that something is meaningful. For example, when estimating the price of a house, it might be worse to underestimate the price of a house and lose money in the transaction rather than posting a very high price and not selling it. For such a case, a custom metric might be desirable, one that places a larger penalty on the model when underestimating the target and a smaller one when overestimating.
A final remark regarding this topic: metrics can take more than one meaning in a Machine Learning project. One of them is, as we just described, that the metric can be used to evaluate the model after it’s trained. Another meaning for metric might be the business metric that’s expected to improve thanks to your machine learning model. You should be mindful of these metrics going into any project.
Extra readings
- You can find a review of the most used metrics for Machine Learning in this article.
6. Visually inspect the results
Alright! We have collected data, cleaned it, trained a model, and checked that the error is small. Are we done? Ye...Almost!
We, humans, are very visual creatures. It is often quite challenging to know if a problem has been correctly solved simply by looking at a metric. Furthermore, as discussed in the previous section, metrics can be deceiving. They often hide flaws in the way that our model has learned (remember the bad student that memorized all the answers).
A great way to solve all these issues at once is to create charts showing the model’s performance under several circumstances.
There are several types of charts that make it easier to understand the outcome of a model:
- Show the predicted value as a function of some of the features. For example, house selling price as a function of the house's area.
- A bar plot comparing the evaluation metric for different groups within the data. For instance, how does the error in predicting house prices change across different neighborhoods?
- If the data contains images, show them, or if it contains geographic locations, plot a map.
- If the data contains temporal data, show how the error evolves over time!


Plots make it easier to share the model’s performance with others and help debug a model that is not working well.
Consider, for example, a model trying to predict who will win the lottery: the model might predict that no one will win and have very high accuracy when, in fact, it is not learning anything (not that it could, but anyway). We might only learn about this behavior when plotting the model’s predicted positive results and finding that there are none!
Back to programming, to produce these visualizations in Python, you’ll need to get a handle on two very important libraries: Matplotlib and Seaborn.
Matplotlib and plotting in Python are synonymous. The library allows users to be as specific as they desire. It is a must-have in your tool belt. Most of the other plotting libraries in Python are implemented on top of Matplotlib, meaning that you will write code using this library sooner or later.
Seaborn is almost a wrapper around Matplotlib that allows users to create plots that look nicer, faster. Since it is built on top of Matplotlib, you can always resort to the former library for very specific customizations.
A word of advice: Plotting in Python is (a bit) cumbersome and takes time to reach a point where you can produce beautiful plots. The best way is to get started now! We recommend the following resources to do so:
Courses
- Here again, first and foremost you should go through Kaggle's Visualization course
- DataCamp has some great hands-on courses on visualization
Documentation
- When in doubt, you can always check the documentation for Matplotlib and Seaborn or their respective tutorials (Matplotlib, Seaborn).
Beyond the essentials
- If you want to go beyond the basic visualizations, there’s a lot of research with regards to optimizing plot format to deliver effective messaging. Check out data-viz resources.
Takeaways
Ooooff, that was a long post. So where should you go from here?
First, we recommend going through all the linked materials. Those are battle-tested and will kickstart your Data Science/Machine Learning Engineer journey.
Once you feel confident, you should get your hands dirty. Although learning from textbooks is a great way to learn the theory, it is when you put those learnings into practice that you get to master these concepts. If you don't know where to start, give some of these projects a try and let us know how you did!
Get more resources, insights and knowledge

Wondering how AI
can help you?

Terms and Conditions | © 2026. All rights reserved.